Seonghyuk Son, Jae Yong Suk, Kristina Knowles, Dongwoo (JASON) Yeom
Music listening experiences can be strongly influenced by the surrounding environment. A recent study conducted by researchers at Arizona State University and the California Lighting Technology Center at the University of California, Davis, investigated how indoor lighting conditions influence music listening satisfaction. The study aimed to examine how different lighting environments affect music perception, as well as the association between lighting satisfaction and music perception. Participants were exposed to a range of lighting conditions while listening to two types of music, categorized as happy and sad, and asked to rate both the emotional experience and how well each piece matched the corresponding lighting setting.
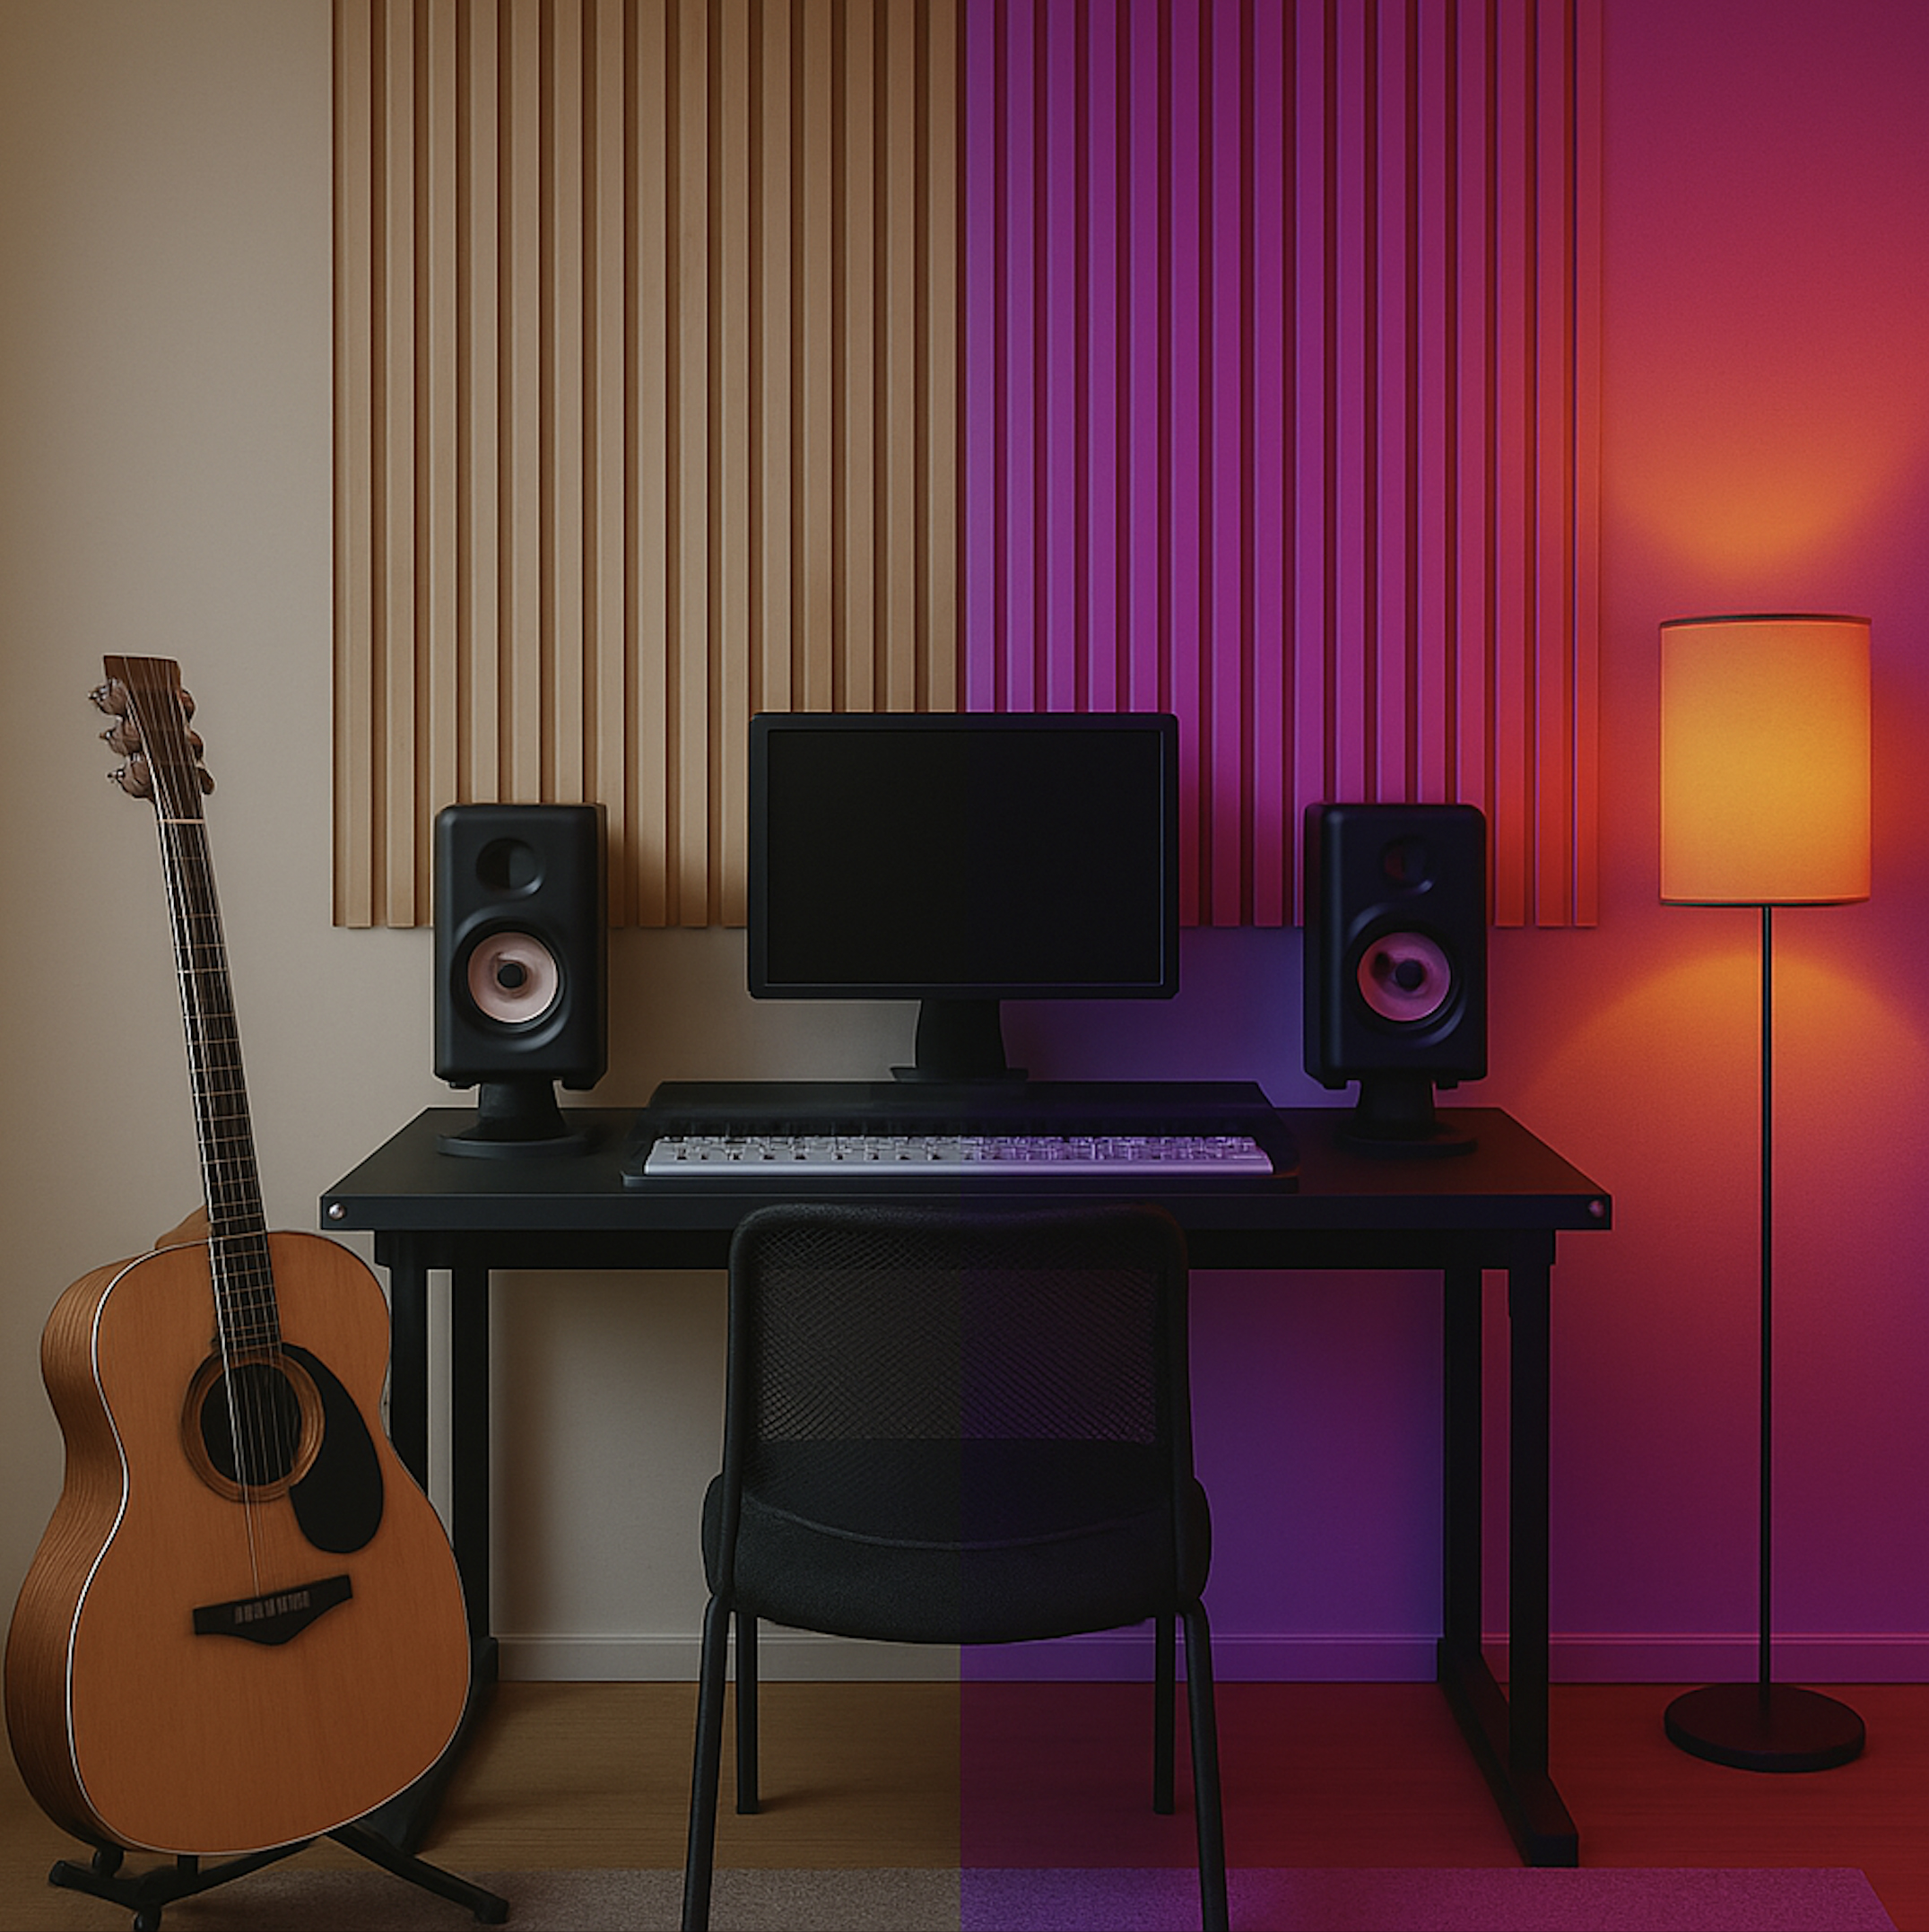
Figure 1. A music listening space illuminated with contrasting lighting.
Music is widely known for its ability to both arouse and express emotions. Numerous studies suggest that one of the primary reasons people engage with music is to influence their emotions, whether to match or amplify their current emotional state, change their mood, experience a cathartic emotional release, seek comfort, or simply increase their enjoyment.1,2 While decades of research have expanded our understanding of the complex relationship between music and emotion, relatively few studies have directly examined how indoor environments influence perceived emotions in music. Given that most musical engagement happens within designed indoor spaces—from concert halls to living rooms, as presented in Figure 1—this scarcity of research examining environmental influences on musical emotion represents a notable gap. The present study examines how different lighting conditions affect the perceived positivity of music and the perceived fit between the music and specific lighting settings. The musical excerpts consisted of popular music pieces that had been previously used in music and emotion research,3 and were limited to excerpts that listeners had reliably rated as either happy or sad.
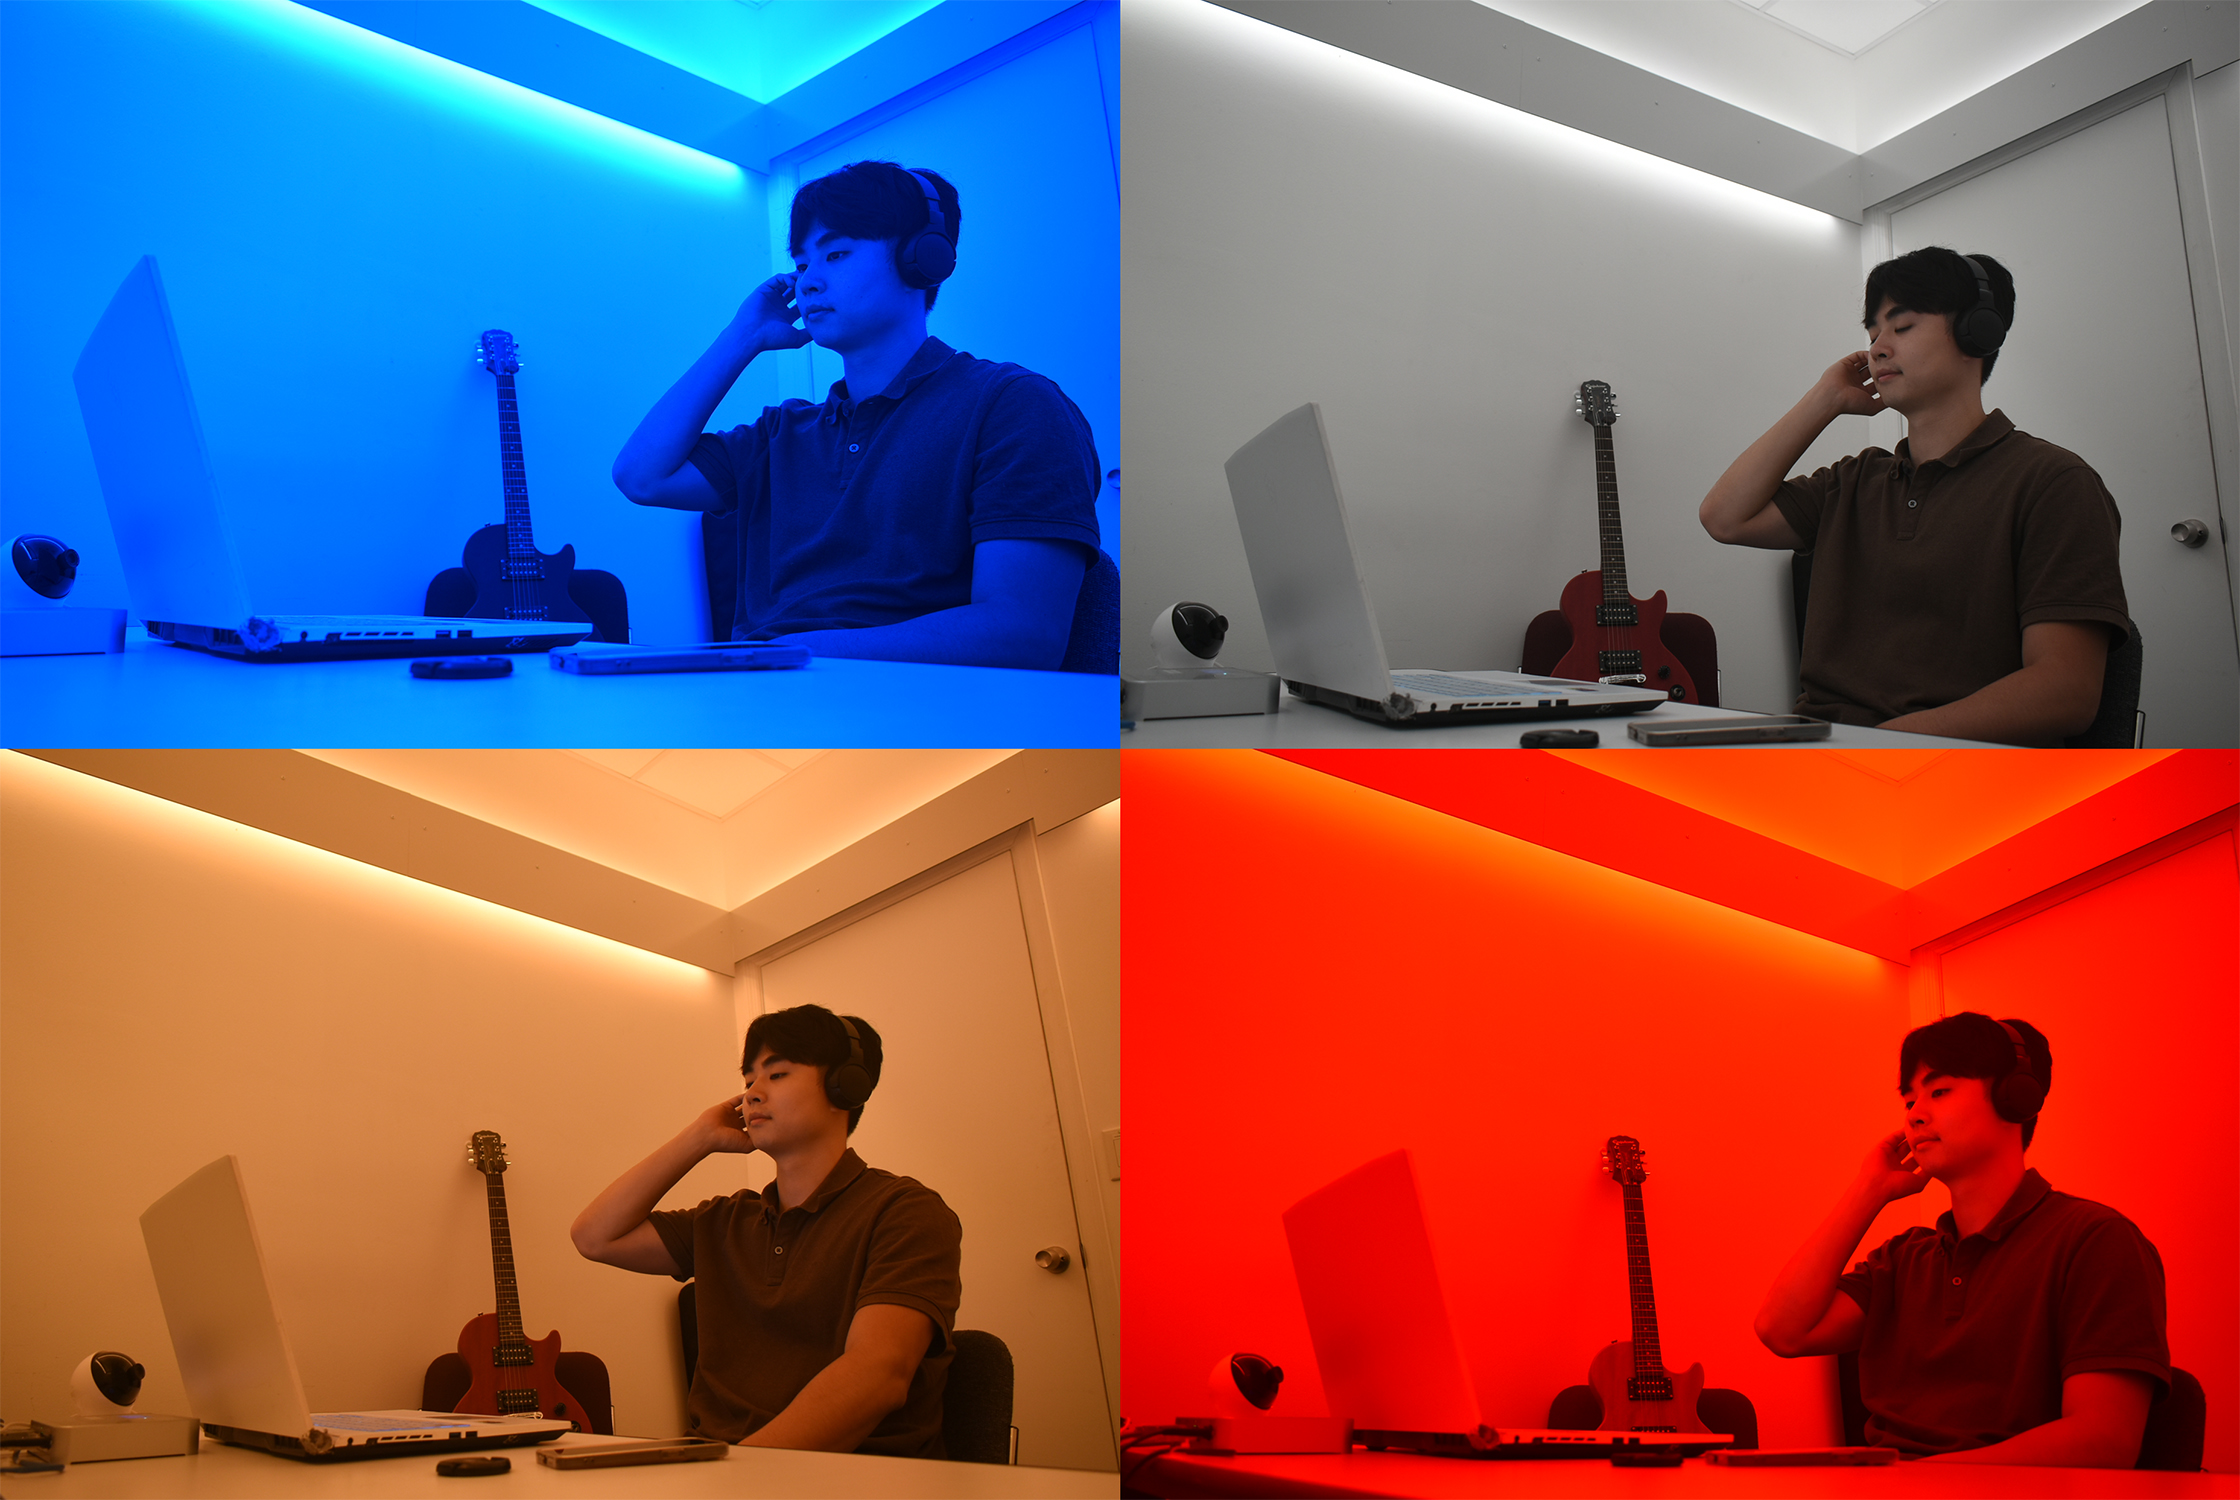
Figure 2. A participant listening to music under different lighting conditions.
The experiments were conducted in a room at Arizona State University outfitted with 12 LED smart lights and a lighting control system, which enabled researchers to adjust lighting CCT and color. The room featured a west-facing window that was covered during the sessions to prevent daylight interference, and the indoor temperature was kept steady at 71.6 deg Fahrenheit (22 deg Celsius) by a portable HVAC system.
A total of 22 participants took part in the study, including 12 males and 10 females. Participants were randomly assigned to one of four experimental lighting conditions: blue (455-nm peak), cool white (5000K CCT, 450-nm peak), red (630-nm peak), and warm white (3000K CCT, 610-nm peak), as shown in Figure 2. Each participant entered a designated room where the lighting condition had been pre-set at random and was given 15 minutes to adapt to the environment. After the adaptation period, they completed a lighting satisfaction survey using a 7-point Likert scale ranging from -3 (Very Dissatisfied) to +3 (Very Satisfied). Participants then listened to 10 1-minute excerpts of music categorized as “happy music.” For each excerpt, they rated 1) how positive or negative the music felt (music positivity rating) and 2) how well the music matched the current lighting condition (lighting-music fit). Both music perception ratings were assessed using a 10-point scale. After a 3-minute break, participants listened to ten additional 1-minute excerpts categorized as “sad music” and repeated the same two ratings for each piece. Finally, participants completed the lighting satisfaction survey again. Each session lasted approximately 45 minutes, and the same participants repeated sessions under different lighting conditions. Following data collection, analysis of variance was performed to investigate the effect of lighting conditions on music perception, using a 95% significance level.
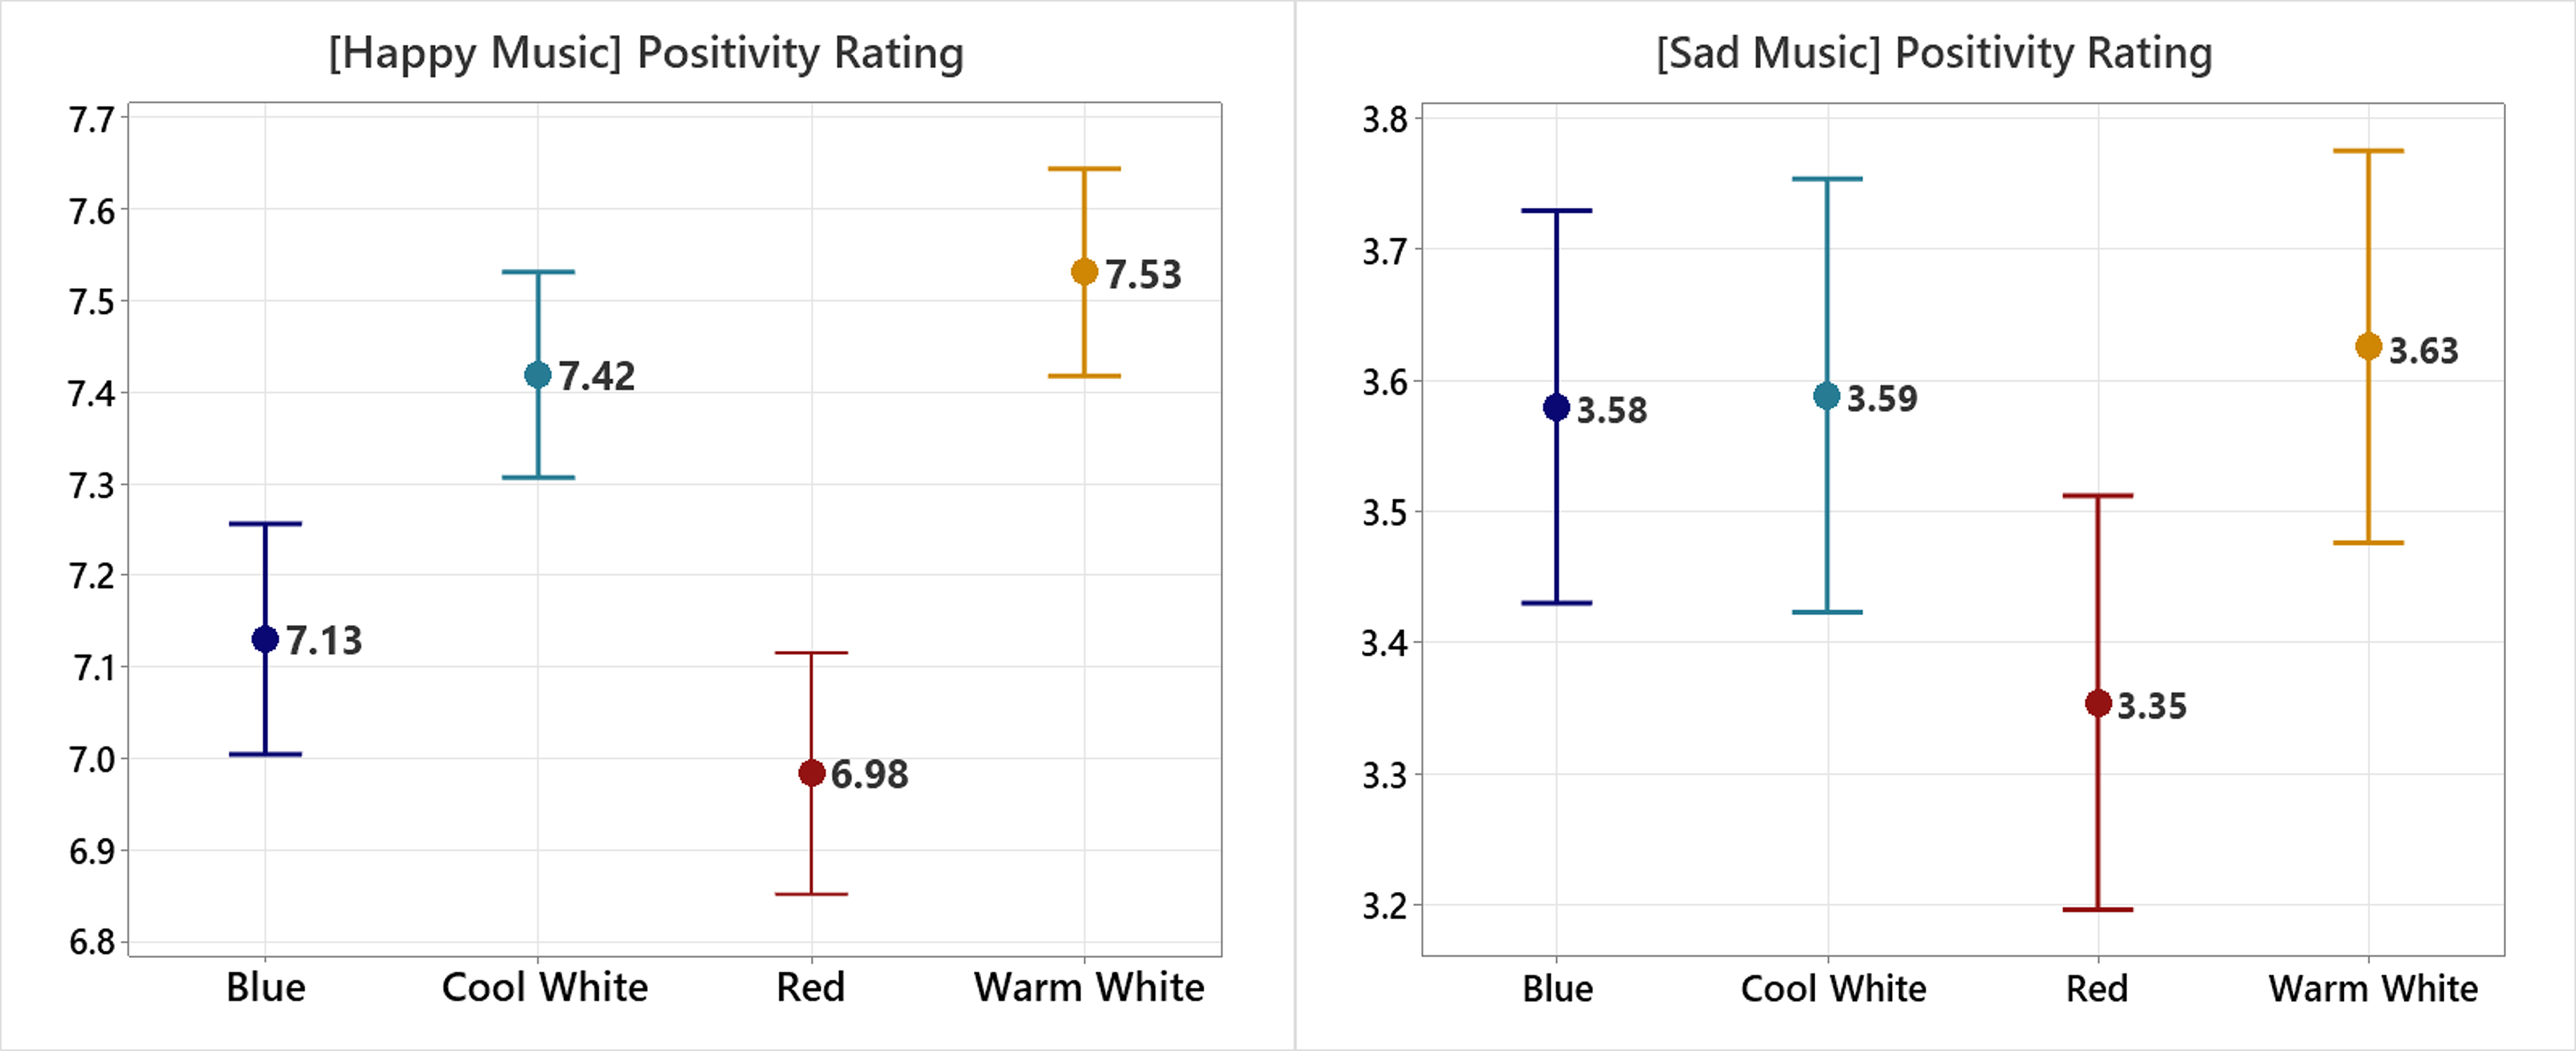
Figure 3. An interval plot of music positivity rating under different lighting conditions.
The music positivity rating analysis reflects participants’ emotional experience of the music, where higher ratings indicate more pleasant or uplifting feelings and lower ratings indicate more muted or melancholic feelings.4 The music positivity rating analysis confirmed that when participants listened to happy music, they gave the highest positivity ratings under warm-white lighting, while the lowest ratings occurred under red lighting, as shown in Figure 3. Ratings under warm white were significantly greater than those under both blue and red conditions. Positivity ratings under cool-white lighting were also significantly higher than under red lighting. Together, these results indicate that happy music is perceived most positively in white lighting conditions, particularly warm white, and least positively under red lighting.
On the other hand, when participants listened to sad music, they gave the lowest positivity ratings under red lighting. However, the differences in ratings among the other lighting conditions were not statistically significant. This indicates that the influence of lighting on perceived positivity or negativity was more pronounced when listening to happy music, whereas for sad music, only red lighting led to a noticeable drop in ratings, with no significant differences observed among the other lighting conditions.
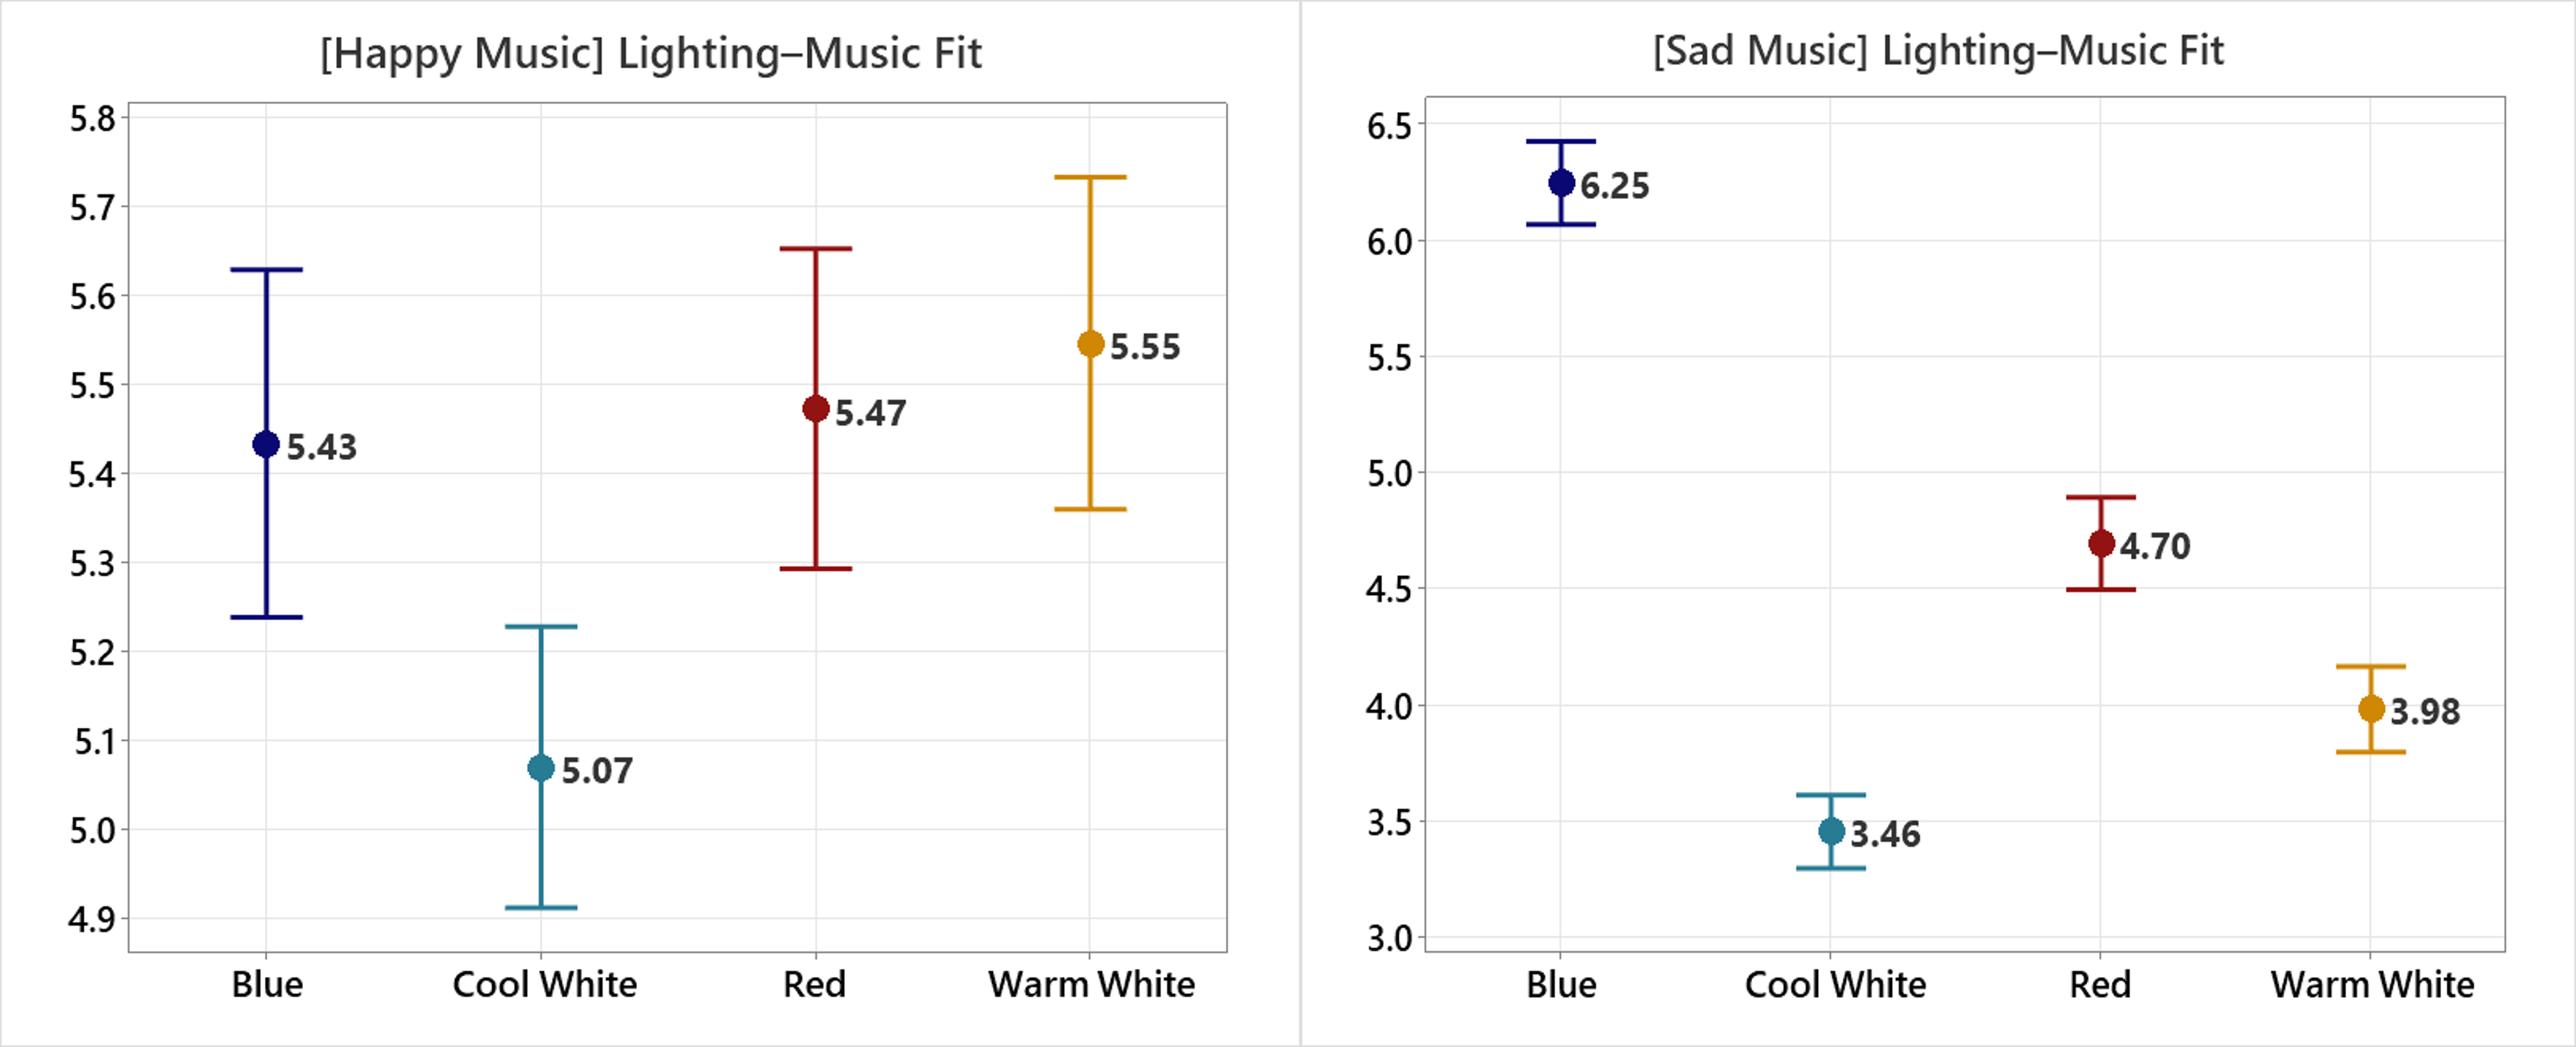
Figure 4. An interval plot of lighting-music fit under different lighting conditions.
The lighting–music fit analysis assessed how well participants felt the current music matched the lighting setting. Happy music received the lowest fit ratings under cool-white lighting, as shown in Figure 4, suggesting that this lighting condition was perceived as the least compatible with happy music. In contrast, no significant differences were observed among blue, red, and warm-white lighting for happy music. When participants listened to sad music, blue lighting received the highest fit ratings, followed by red, warm white, and cool white, respectively. These findings indicate that the best lighting fit differs depending on whether the music is happy or sad. Blue lighting stood out as a significantly better match for sad music than the other lighting conditions.
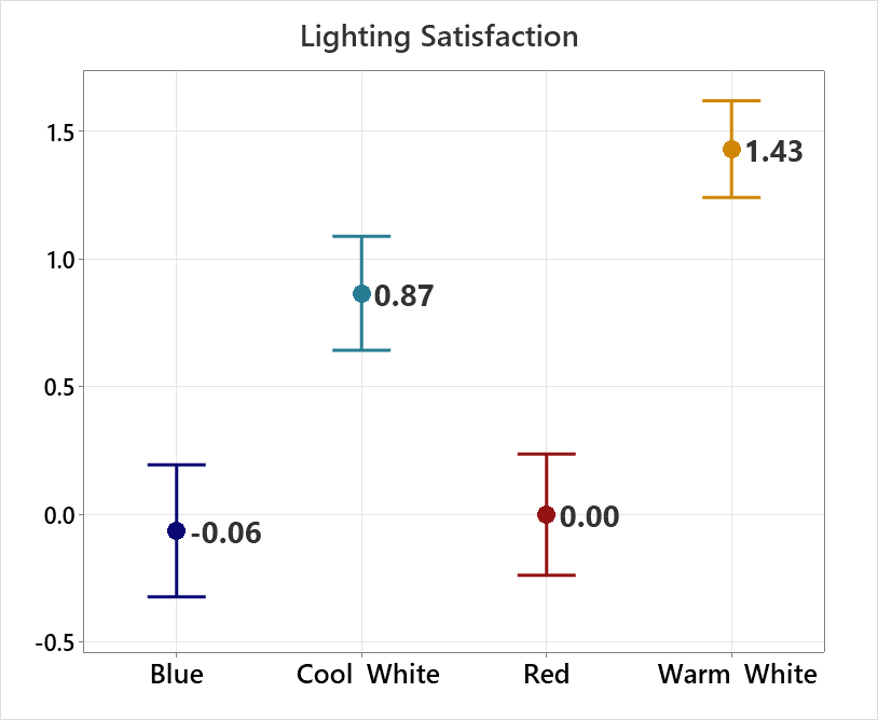
Figure 5. An interval plot of lighting satisfaction under different lighting conditions.
The results of lighting visual satisfaction indicate that the lighting conditions have a notable effect on participants’ satisfaction, as shown in Figure 5. Among the conditions, warm-white lighting received the highest satisfaction rating, indicating that participants found it the most satisfying. Cool-white lighting followed with a moderate level of satisfaction. In contrast, red lighting received a neutral rating (0.00), suggesting neither satisfaction nor dissatisfaction. Blue lighting received the lowest average score, reflecting slight dissatisfaction among participants, though the rating remained close to neutral. These results indicate that participants showed significantly different levels of satisfaction depending on the lighting condition.
The results of this study show that indoor lighting can significantly influence how people experience music and perceive their surroundings. When listening to happy music, participants rated the music most positively under the warm-white lighting condition. Warm-white lighting also received the highest visual satisfaction ratings compared to other lighting conditions. This alignment, clearly observed through similar patterns in positivity ratings for happy music (Figure 3) and visual satisfaction ratings (Figure 5), indicates that people naturally associate warmer lighting with upbeat, cheerful music. Together, these results suggest that indoor lighting might play a role in how positively we feel about music, especially when the music itself is happy. Cool-white lighting, despite generally being visually acceptable, was rated as the least fitting for happy music. This indicates that neutral or cooler-toned lighting might feel emotionally disconnected from upbeat music. Thus, designers should consider not just visual comfort but also the emotional compatibility between lighting and music type.
In contrast, a different pattern emerged when participants listened to sad music. Although lighting generally had less impact on positivity ratings for sad music, participants consistently rated red lighting lowest in both visual satisfaction and positivity. Blue lighting, however, stood out as the most fitting for sad music, suggesting that cooler tones can resonate emotionally with slower, more melancholic music. Overall, these findings suggest that lighting influences more than just visual satisfaction, it also plays a meaningful role in shaping how people experience music. Recognizing this relationship can help designers and researchers develop lighting environments that support emotional engagement and enrich music-listening experiences.
These results highlight opportunities for designing illuminated environments that enhance the alignment between visual and auditory stimuli, particularly by considering the emotional tone of the music. Traditionally, research on lighting has focused on visual comfort or productivity, often overlooking how lighting may influence emotional perception in listening to music. This study examined the effects of lighting conditions on music perception, such as positivity ratings, lighting-music fit, and lighting satisfaction. By doing so, it contributes to a deeper understanding of how different lighting environments can enhance or diminish the emotional impact of music. This opens new possibilities for optimal, emotionally responsive lighting design in spaces where music is a central element, such as studios, therapeutic settings, or everyday home environments.
Building on the current findings,5 future research could incorporate physiological measures, such as heart rate or skin temperature, providing objective data to complement subjective survey responses and reveal how people emotionally and physically react to music under different lighting. This could enable predictive modeling of music perception using biometric data. Beyond lighting, future studies might also integrate other indoor environmental factors, such as temperature, to examine how multiple sensory elements work together to influence music perception. This may help create comprehensive and optimal indoor environments for music listening.
the authors | Seonghyuk Son is a Ph.D. candidate and research assistant in the Richard A. McMahan School of Architecture at Clemson University.
Jae Yong Suk is the faculty director of the California Lighting Technology Center and an associate professor in the Department of Design at UC Davis.
Kristina Knowles is affiliate faculty in Music Theory and Psychology at Arizona State University, where she taught undergraduate and graduate courses on music theory and music cognition as an assistant professor.
Dongwoo (Jason) Yeom is the Thompson E. Penney and Gretchen M. Penney Endowed Distinguished Associate Professor in the Richard A. McMahan School of Architecture at Clemson University.
1 Yoshihiko Muramoto, Masahiro Ki1 Y. Song et al., “Perceived and Induced Emotion Responses to Popular Music: Categorical and Dimensional Models,” Music Perception, vol. 33, no. 4, 2016.
2 Roberto Bresin and Anders Friberg, “Emotion Rendering in Music: Range and Characteristic Values of Seven Musical Variables.” Cortex: A Journal Devoted to the Study of the Nervous System and Behavior, vol. 47, no. 9, Oct. 2011, pp. 1068–81.
3 Alf Gabrielsson and Erik Lindström. “The Role of Structure in The Musical Expression of Emotion.” Handbook of Music and Emotion: Theory, Research, Applications, Oxford University Press, 2010, pp. 367–400.
4 K. Kallinen and N. Ravaja, “Emotion perceived and emotion felt: Same and different,” Musicæ Scientiæ, 10(2), 2006, pp.191-213.
5 Carol Krumhansl, “An Exploratory Study of Musical Emotions and Psychophysiology,” Canadian Journal of Experimental Psychology, vol. 51, no. 4, 1997, pp. 336–52.