Polyethylene Pipe Performance – Observations & Insights from Experimental Investigations
Previous Article Next Article
By Ashish M. Sukhadia, Mark J. Lamborn & Pamela L. Maeger
Chevron Phillips Chemical Co. LP
Polyethylene Pipe Performance – Observations & Insights from Experimental Investigations
Previous Article Next Article
By Ashish M. Sukhadia, Mark J. Lamborn & Pamela L. Maeger
Chevron Phillips Chemical Co. LP
Polyethylene Pipe Performance – Observations & Insights from Experimental Investigations
Previous Article Next Article
By Ashish M. Sukhadia, Mark J. Lamborn & Pamela L. Maeger
Chevron Phillips Chemical Co. LP
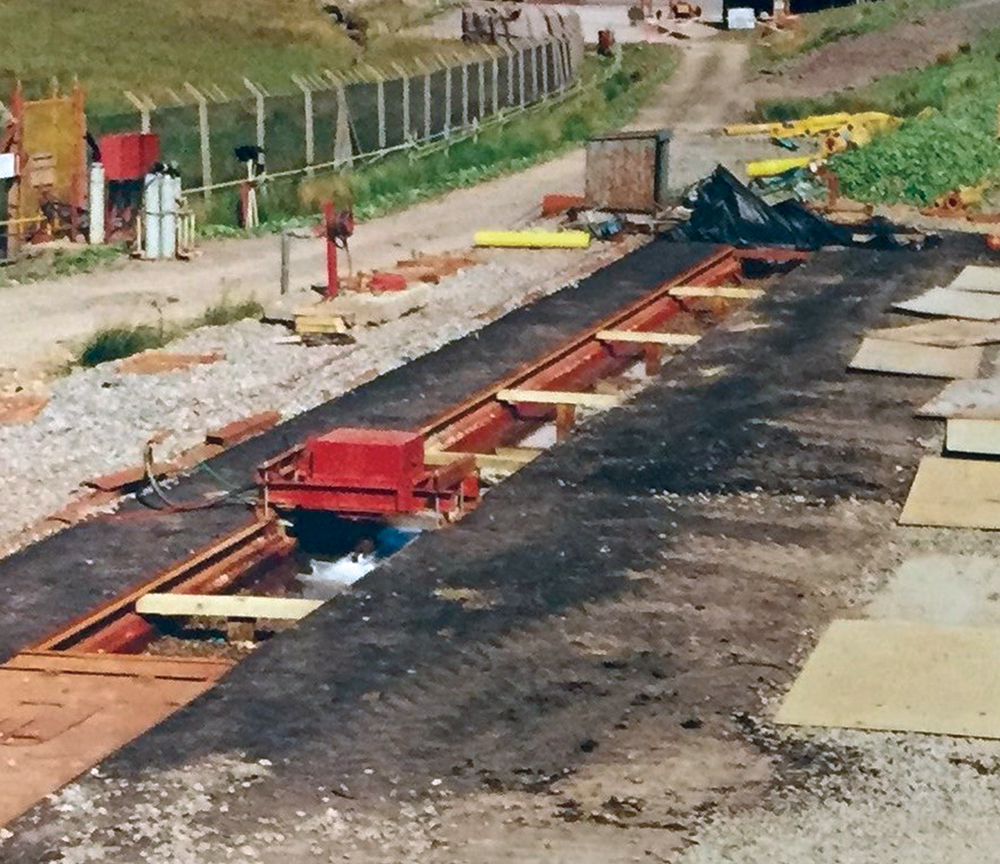
Full-scale RCP test pit being prepared. Courtesy of Chevron Phillips Chemical Co. LP
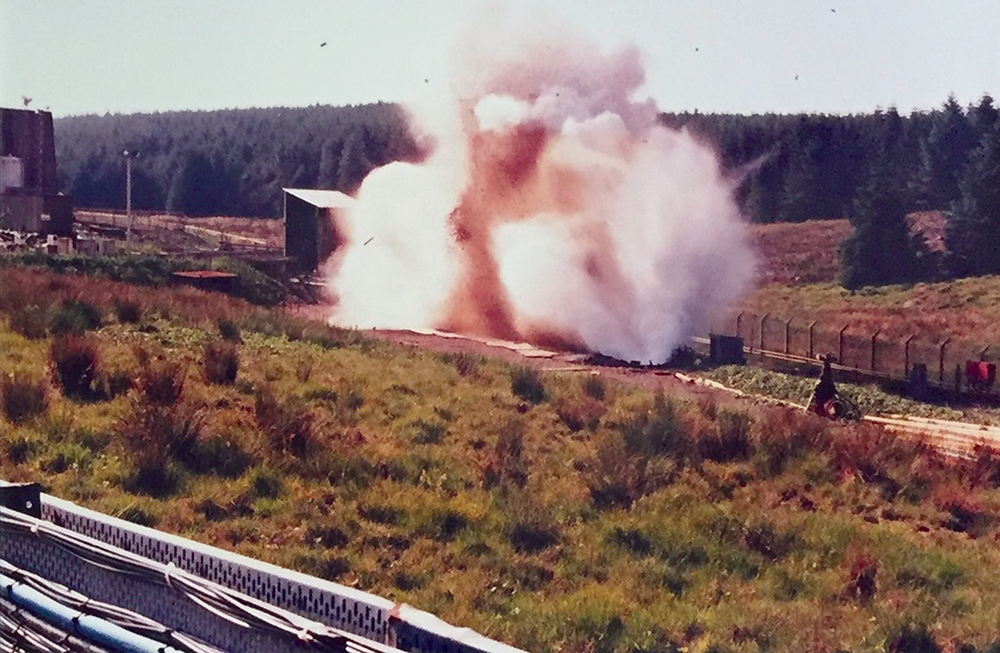
Full-scale RCP test in progress. Courtesy of Chevron Phillips Chemical Co. LP
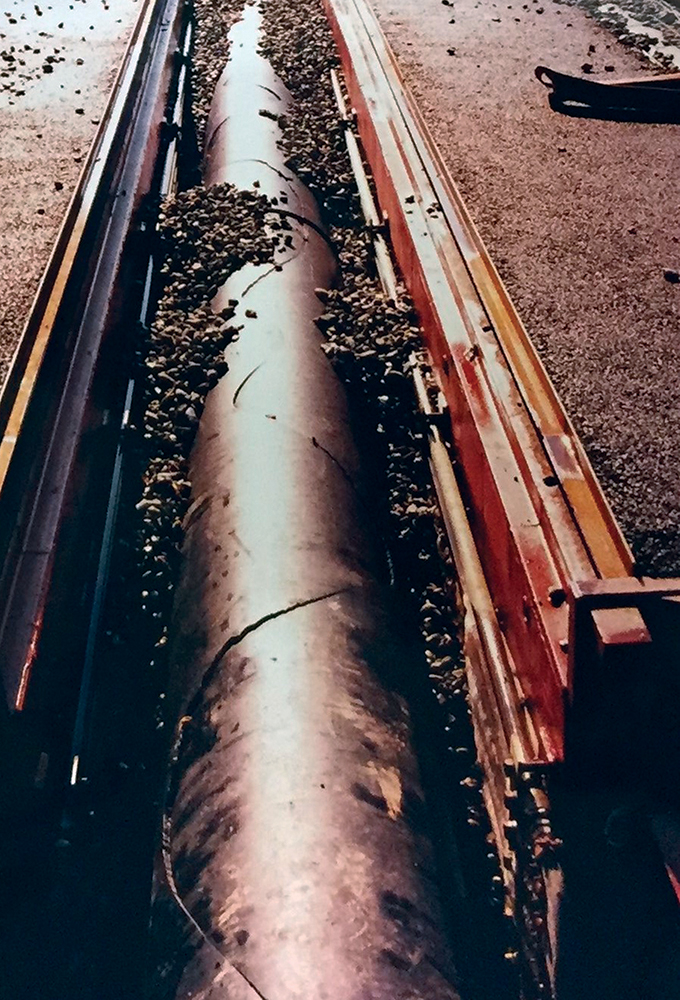
Pipe in the test pit, after RCP test is concluded. Courtesy of Chevron Phillips Chemical Co. LP
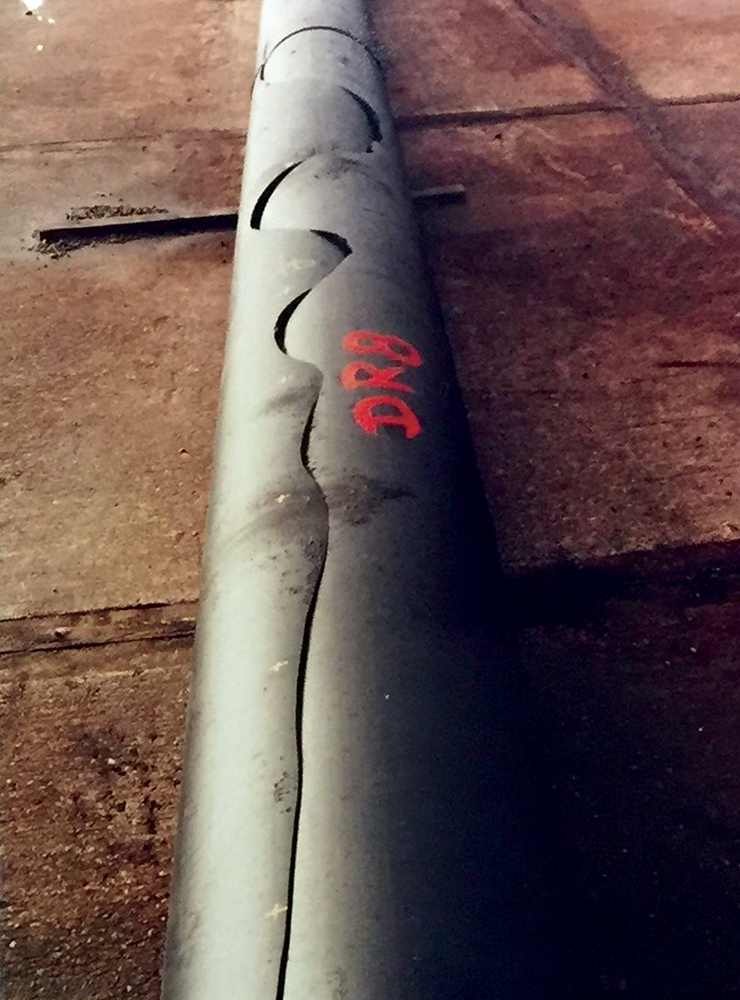
Test pipe fully removed from the test pit. The crack propagation is visible through the full length of the pipe. Courtesy of Chevron Phillips Chemical Co. LP

Figure 1. RCP Pressure-Temperature failure envelopes for three polyethylene pipes of differing molecular architecture - (a) Resin M, (b) Resin H, (c) Resin B-H, as described further in the text. The points with gold “stars” in each plot above represent measured data points where tests were conducted. The others data points are inferred. Courtesy of Chevron Phillips Chemical Co. LP

Figure 2. Correlation of Tc,S4 and Pc,S4 for 16 different pipes made using a variety of PE architectures including unimodal, bimodal, PE80, PE4710 and PE100 classes. All pipes were 8 inch (200 mm) SDR 11 size and were manufactured on commercial pipe fabrication equipment. All S4 data was generated in-house on the same S4 test machine. The results suggest a unique correlation between Tc,S4 and Pc,S4 for pipes of a given size, independent of resin structure effects such as molecular weight, density, etc. Courtesy of Chevron Phillips Chemical Co. LP

Table 1. Critical Pressure (Pc) measured using the Full-Scale (Pc,FS) test and S4 (Pc,S4) test. The correlation factor F is calculated using Equation (2) in the text.

Table 1. Critical Pressure (Pc) measured using the Full-Scale (Pc,FS) test and S4 (Pc,S4) test. The correlation factor F is calculated using Equation (2) in the text.

Table 2. Effect of extrusion rate and temperature on the processing and RCP performance of 2 inch SDR 11 pipe. All pipes were made with the same medium density polyethylene pipe grade resin. All pipes were natural (no carbon black).

Table 2. Effect of extrusion rate and temperature on the processing and RCP performance of 2 inch SDR 11 pipe. All pipes were made with the same medium density polyethylene pipe grade resin. All pipes were natural (no carbon black).
Over the past number of years, we have conducted extensive investigations of the rapid crack propagation (RCP) behavior of polyethylene pipes. In this paper, we report on our findings on the relationship between the small-scale steady state (S4) RCP test and the full-scale RCP test. We also report on the behavior of three different PE resins by generating the more extensive critical temperature – critical pressure maps (“failure envelopes”), which provide a more comprehensive view of the RCP behavior of PE. Next, using data generated in our laboratory, we report on a new observation relating critical temperature and critical pressure. Lastly, we consider the effects of extrusion rates and conditions on RCP performance. These results, taken together, allow us to make some interesting observations and offer newer insights about the RCP behavior of PE resins and pipes.
Introduction
Polyethylene has been recognized as a robust piping material for more than 50 years now. Compared to other materials such as ductile iron, steel and cement pipes, PE pipes generally can offer numerous advantages, e.g., higher toughness, greater flexibility, improved durability, corrosion resistance, fusion integrity, low maintenance, light weighting, ease of installation and lower system costs. One important consideration for the use of PE pipes, particularly in more critical applications such as gas distribution systems, is that of resistance to rapid crack propagation. RCP is a specific mode of pipe failure that may occur, but only under certain specific conditions (and combinations) of pipe size, pressure (internal stress) and temperature, resulting in a rapidly growing (100-300 m/s velocity) longitudinal crack that may propagate large distances (hundreds or thousands of meters) prior to crack arrest.
It’s important to note that such an RCP event also requires a specific triggering event to create and initiate this fast, brittle fracture. Although RCP events in PE pipes are still quite rare, the potentially catastrophic nature of this particular fast failure mode has sparked interest in understanding the phenomena so that PE pipes may be designed to eliminate RCP events altogether.
Two standard test methods are available to measure the RCP performance of pipes; specifically, the full-scale (FS)1 and small-scale steady-state (S4)2 tests. The FS test acts as the primary or reference method for characterizing the RCP performance of pipe systems. A good overview of the two tests may be found in Greig et al.3 and Patadia et al.4
Chevron Phillips Chemical Co. LP (CPChem) acquired the ability to measure RCP performance of PE pipes with the purchase, installation and commissioning of an S4 test unit in 2004. Since then, CPChem has performed more than 350 S4 critical pressure (Pc,S4) and S4 critical temperature (Tc,S4) tests in an effort to characterize and better understand the RCP performance of PE pipe systems. These data were generated using PE pipes of varying sizes ranging from 2 inch (50 mm) to 8 inch (200 mm) diameter and thickness (standard dimension ratio, SDR). The resins used were both experimental and commercial grades, having widely varying unimodal or bimodal architectures and of different classes (PE80 vs. PE100). Furthermore, the data set includes a mix of pipes fabricated under both laboratory and commercial extrusion conditions.
Following are some of our key observations and insights relating to the RCP performance of PE pipes.
Experimental
RCP testing was performed using either the full-scale test method per ISO 134781 or the small-scale steady state test method per ISO 134772. In the full-scale test, only critical pressure (Pc,FS) was measured at 0°C constant temperature. In the S4 tests, either critical pressure (Pc,S4) was measured at 0°C constant temperature or critical temperature (Tc,S4) was measured at 5 bar (72.5 psig) constant pressure test conditions. Full-scale tests were done at external laboratories. Chevron Phillips performed the S4 tests at its research center in Bartlesville, Okla., on an IPT model 1629 S4 test system in conjunction with a specimen conditioning freezer manufactured by Russells Technical Products.
We extruded pipes that were 2-inch (50 mm) diameter on a laboratory pipe line. We had other, larger-diameter pipes extruded on commercial pipe lines at commercial processing conditions unless noted otherwise.
Results, Analysis & Discussion
S4 to Full-Scale Correlation Factor (F)
While the full-scale test is widely understood to be “field representative,” it is both cumbersome and expensive to perform. Those realities paved the way for the laboratory-scale S4 test to be developed5. That, however, gave rise to questions about how the S4 test correlated to the full-scale test. Greenshields and Levers published their findings for PE 110 mm (4.33 in) pipes6 and concluded that a conservative correlation was a ratio of 3.6 or expressed in the following equation as:
Critical Pressure, Pc = Pc,FS = 3.6(Pc,S4) + 2.6 … (1)
with all units in Eq. (1) above in bars. It should be noted that the generalized and correct form of the equation for the correlation factor F, that relates Pc,S4 to Pc,FS is:
Critical Pressure, Pc = Pc,FS = F (Pc,S4) + (F-1) …(2)
again, with all units in Eq. (2) also in bars and Pc,FS and Pc,S4 denoting the gage pressure in bars4.
In this work, and over the period of many years, we have measured the critical pressure of several pipes in both the S4 as well as Full-Scale tests and the results are shown in Table 1. Based on the data in Table 1, our findings clearly suggest that the current S4-to-FS conversion ratio of 3.6 that is in use is in fact quite conservative and that a more accurate ratio is 4.5-5.0. This is important to understand and note because, as mentioned previously, full-scale testing is both difficult and expensive to perform. As a result, not a lot of full-scale test data are readily available. The practice then is to conduct S4 tests, use equation (1) to convert to an expected critical pressure (Pc=Pc,FS) and use that Pc value for evaluating the suitability of the pipe for a given service pressure rating.7
Pc,S4-Tc,S4 Failure Envelopes
To enhance our overall understanding of the RCP behavior of PE resins, we examined three different PE resins of different molecular architecture viz., a unimodal MDPE resin (Resin M), a unimodal HDPE resin (Resin H) and a bimodal HDPE (Resin B-H) resin. In each case, the resin was converted into 8-inch (200 mm) nominal diameter pipe having a standard dimension ratio (SDR) of 11 and tested for RCP performance as follows. Here, in addition to the Pc,S4 data, we also obtained the Critical Temperature (Tc,S4) data via S4 testing by conducting a series of tests at a fixed pressure of 5 bars and at variable test temperatures. The Tc,S4 is then defined as the lowest temperature producing an arrest event, above the highest temperature producing a propagation event.
Thus, to develop the full RCP failure envelopes for the three resins described above, pipes from Resins M, H and B-H were tested at various pressures between 0.8 - 5.0 bar and a range of test temperatures from -50°C to 20ºC in increments of 10ºC. The Pc,S4 was converted to Pc,FS using equation (1) and then the RCP pressure-temperature failure envelope maps for the three different pipes generated as shown graphically in Figure 1(a)-(c). The blue dashed line is a “freeform,” hand-drawn curve to guide the eye and provide a visual sense of the failure envelope as a function of pressure and temperature.
For a pipe system made using a specific resin and of a given pipe size (pipe diameter and SDR), the RCP failure envelope defines the particular combinations of pressure and temperature at which susceptibility to RCP is expected or not. Thus, service conditions falling on, or below, the RCP failure envelope (blue dashed lines in Figure 1) are not expected to produce RCP propagation events (failures), while service conditions above this envelope are expected to be susceptible to RCP failures. We would like to emphasize that operating conditions in the “susceptible” region do not imply that RCP propagation will necessarily happen. Rather, they signify a region where if the requisite crack initiation conditions are met, propagation may occur.8 Comparison of the failure surfaces between resins shows that the HDPE bimodal Resin B-H exhibits the best performance (broadest operating area below the failure envelope), followed by Resin H and Resin M. The failure envelope for Resin B-H is shifted to lower temperatures and higher pressures relative to Resins M and H, thus representing overall improved resistance to RCP.
Inspection of all failure envelopes shows that, as expected, the susceptibility to RCP failures for all resins increases with decreasing temperature. A closer inspection of the very low temperature data (below -20°C) in Figs. 1(a)-(c), however, shows that the differences in the failure envelopes are decreasing with decreasing temperature. It is also of great interest to note that all three data sets represented in Figs. 1(a)-(c) level off to a plateau (below which the RCP response does not change much with pressure at any given temperature) at the lower temperatures. In each case, we observed that no RCP propagation occurs even at the lowest test temperatures of -40°C to -50°C when tested at 5 bar or lower pressures. This clear flattening trend of the failure envelope over a broad range of low temperatures suggests that there is a small FS pressure (~5 bar) below which RCP events are not expected at any temperature.
The observed low-temperature plateau region here is in very good agreement with previous results by Leevers et al.9 For a broader range of polyethylene grades, they concluded that “S4 test critical pressures vary strongly with temperature, falling at low temperatures to a plateau which differs little between very diverse materials.” It would appear, therefore, that this observation has a more fundamental origin and our data here lend additional support to Leevers’ original observation. All of the above results taken together, however, indicate that the resin architecture differences play a much lesser role in determining RCP performance at very low temperatures, in contrast to the RCP behavior at higher temperatures where much bigger differences in RCP susceptibility and performance are readily observed.
Critical Pressure-Critical Temperature Relationship
When reporting RCP results, the normal convention that has developed in the field is to report the Pc,S4 or Tc,S4 (or both). However, and to our best knowledge, there has not been any effort or discussion to understand or link these two test results in conjunction with one another. It was our view that although the critical temperature and critical pressure tests are indeed performed differently and using different test protocols, they are still both measures of the inherent RCP performance of the pipe. Thus, the two results should be somehow connected.
In order to probe this further, we reviewed our database and pulled out Pc,S4 and Tc,S4 data we had on 16 different pipe samples, made with a variety of PE resins that included unimodal, bimodal, PE80, PE4710 and PE100 classed resins. All these data were generated in-house on the same S4 test machine and all pipes were 8-inch (200 mm) SDR 11 size. All pipes were made on commercial pipe lines at representatively commercial-scale production conditions.
We plotted the Tc,S4 versus Pc,S4, and show the results in Figure 2. We observed a surprisingly good correlation, and it is evident that as Tc,S4 decreases (RCP performance improves), Pc,S4 also increases. [It is clarified that the curve-fit was simply a best fit to the data. Furthermore, the choice of the x and y axis variables was somewhat arbitrary – but was chosen to show Pc,S4 as the independent variable as it is experimentally easier to perform Pc tests compared to Tc tests.]
The fact that Figure 2 was obtained using data from a variety of different PE resin types is what makes the observed correlation both surprising and interesting. This suggests that at least for a fixed pipe size, and perhaps for the sake of consistency, data generated on the same S4 machine, there appears to be a unique relationship between the Tc,S4 and Pc,S4. Analyzed differently, and perhaps more intriguingly, the data strongly suggest that knowing either just the Tc,S4 or Pc,S4, one might be able to readily estimate the other unknown property using some type of a “master curve” that is based on a given pipe size. That is, if Pc,S4 is known, Tc,S4 could be estimated (predicted) and vice-versa from a correlation similar to that seen in Figure 2.
Effect of Extrusion Conditions on RCP
Lastly, we report on the effects of extrusion rate and temperature on RCP performance. A single medium-density pipe grade PE resin was extruded into 2-inch SDR 11 pipes at three different extrusion rates and two extrusion set temperatures as shown in Table 2. This was done on a laboratory pipe line. We then evaluated the pipes for Tc,S4, and show the results in Table 2. It was surprising to see that there was a very pronounced effect of extrusion rate, and less so of extrusion temperature, on the RCP performance. At both set temperatures, there was a clear decrease in S4 critical temperature with increasing extrusion rate, indicating improvements in RCP performance.
While the exact reasons for the improvements in RCP with rate are not fully understood, we believe that the results may be a combination of relatively higher densities and lower residual stresses in the higher-rate pipes due to viscous heat generation and some level of “in-line” annealing. Both higher density10 and lower residual stresses11 have been shown to improve RCP performance in PE pipes.
Conclusions
Our research shows that the conversion factor, F, between S4 and full-scale RCP tests in use today is quite conservative. While the factor in use today is 3.6, our results show that the factor is closer to 4.5-5.0. Detailed critical temperature-critical pressure maps for three different types of PE resins show that the effects of polymer architecture are more pronounced at higher temperatures. At lower temperatures (below ca. -20°C), the RCP behavior of the three resins is more similar and all show a low-temperature plateau where RCP propagation at low pressures does not appear to occur. A new observation from this work shows that for a given size pipe, there appears to be a unique correlation between critical temperature and critical pressure, independent of resin type. Lastly, our results showed that there was a very pronounced effect of extrusion rate on RCP critical temperature – as rate increased, RCP performance increased quite noticeably. These results add new insights into the RCP behavior of PE pipes.
References
- ISO 13478:2007, Thermoplastics pipes for the conveyance of fluids - Determination of resistance to rapid crack propagation (RCP) - Full-scale test (FST), (2007).
- ISO 13477:2008, Thermoplastics pipes for the conveyance of fluids - Determination of resistance to rapid crack propagation (RCP) - Small-scale steady-state test (S4 test), (2008).
- J.M. Greig, P.S. Leevers and P. Yayla, Engineering Fracture Mechanics, 42(4), 663-673 (1992).
- H. Patadia, K. Lively, M. Lamborn, P. Maeger and A. Sukhadia, SPE ANTEC Conf. Proc., 436 (2013).
- P.S. Leevers, P.N. Freeman and M.M. Arthur, Plastics Rubber and Composites Processing and Applications, 24, 113-121 (1995).
- C. Greenshields and P. Leevers, Plastics, Rubber and Composites, 28(1) 20-25 (1999).
- G. Palermo et al., Plastics Pipe XIV, September 22-24, Budapest, Hungary (2008).
- P.S. Leevers, Plastics Rubber And Composites Processing And Applications, 27(410-414), (1998).
- P.S. Leevers, G.P. Venizelos and R.E. Morgan, Proceedings of the 13th Plastic Fuel Gas Pipe Symposium, American Gas Association, San Antonio, TX, USA (1993).
- E. Nezbedová, P. Šindelá and P. Bohatý, Plastics Pipes XII, Milan, Italy, April 19-22, (2004).
- M.J. Lamborn and A.M. Sukhadia, Plastic Pipes XV, British Columbia, Canada, Sept. 20-22, (2010).
ABOUT THE AUTHOR
 A 30-year member of SPE, Ashish M. Sukhadia, Ph.D., joined (then) Phillips Petroleum Co.’s R&D organization in Bartlesville, Okla., in mid-1991, was named the company’s Outstanding Young Scientist in 1997, and has served as global polyethylene applications manager for Chevron Phillips Chemical Co. since 2009.
The holder of 30 patents, Sukhadia was elected an SPE Fellow in 2014. This paper earned the Best Paper Award from the Pipe Special Interest Group at SPE’s 2016 ANTEC Conference.
His co-authors on this paper were Chevron Phillips colleagues Mark J. Lamborn, senior research engineer, and Pam L. Maeger, pipe technical service supervisor.
