Formulation Strategy to Achieve Highly Colorable and Weatherable ASA
Previous Article Next Article
By Steven D. Blazey
A. Schulman, Inc., Akron, Ohio, USA
Formulation Strategy to Achieve Highly Colorable and Weatherable ASA
Previous Article Next Article
By Steven D. Blazey
A. Schulman, Inc., Akron, Ohio, USA
Formulation Strategy to Achieve Highly Colorable and Weatherable ASA
Previous Article Next Article
By Steven D. Blazey
A. Schulman, Inc., Akron, Ohio, USA
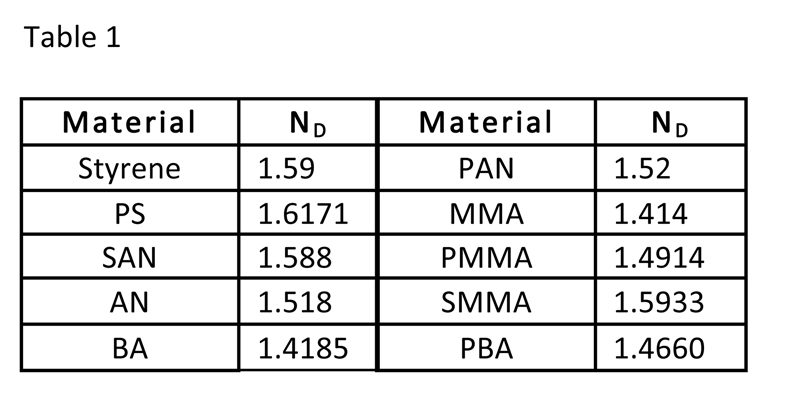
Table 1: Refractive Index (ND) Variations
Table 1: Refractive Index (ND) Variations
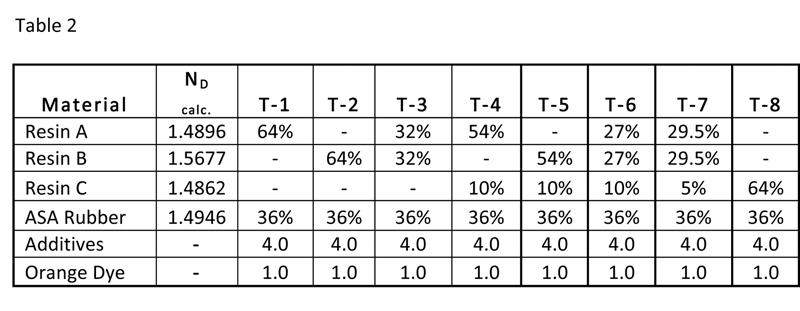
Table 2: ASA Formulation Trials Matrix
Table 2: ASA Formulation Trials Matrix
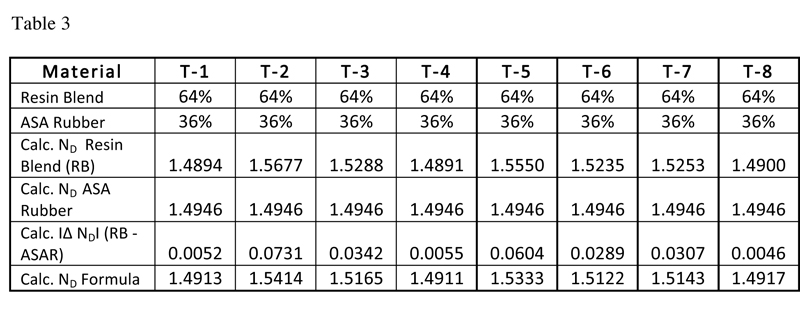
Table 3: Refractive Index Calculations and Δ Values
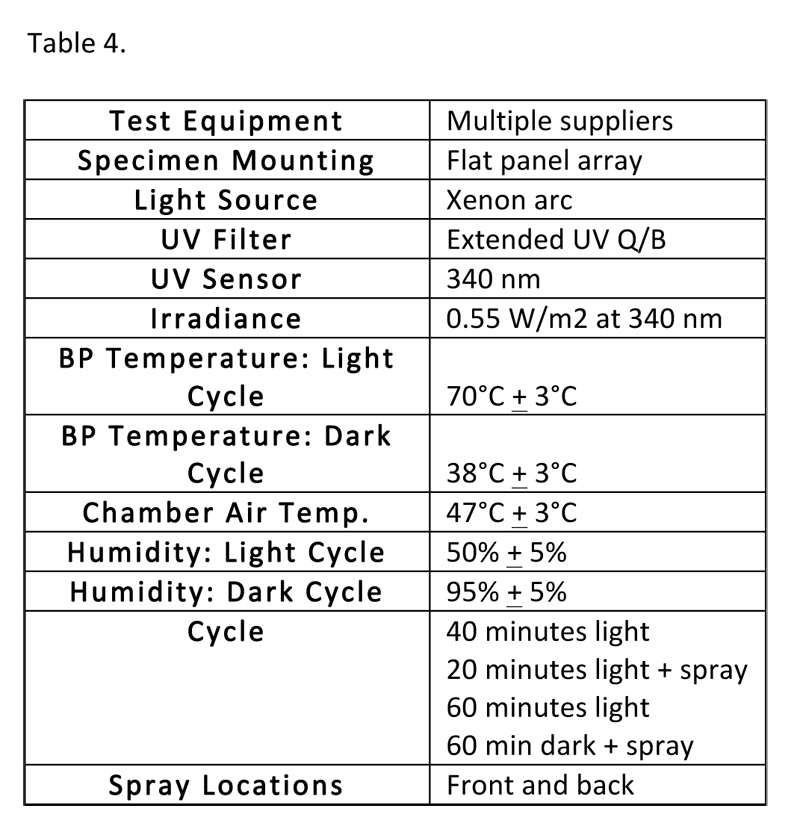
Table 4: SAE J2527 (2004-02) Test Conditions Used
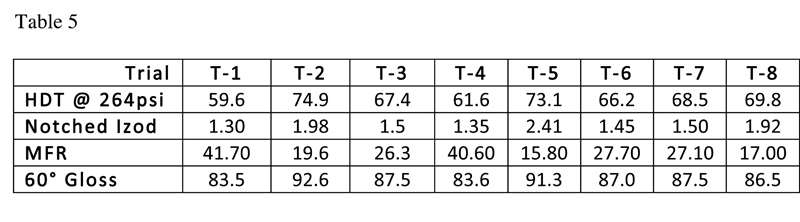
Table 5: Physical Properties Summary
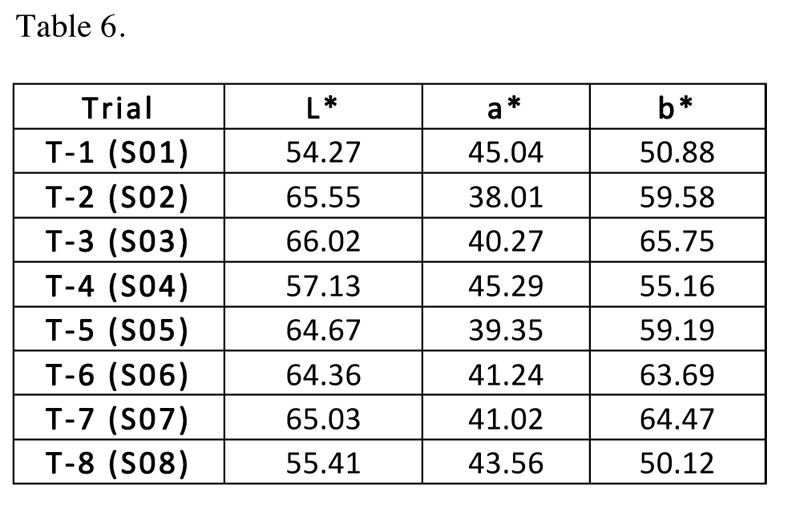
Table 6: Absolute Color Computer Results Before Weathering
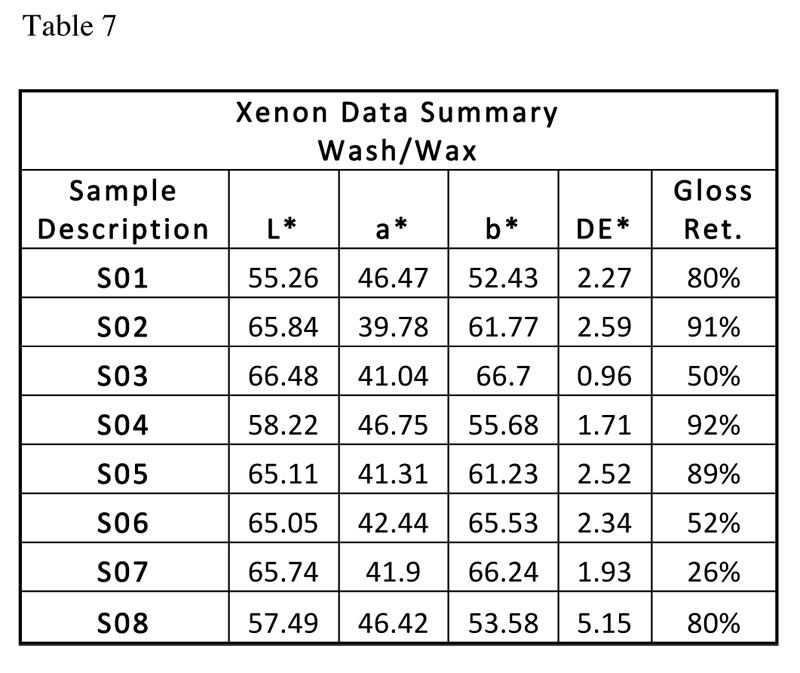
Table 7: Color Data After 2326kJ/m2 Weathering After Washing and Waxing
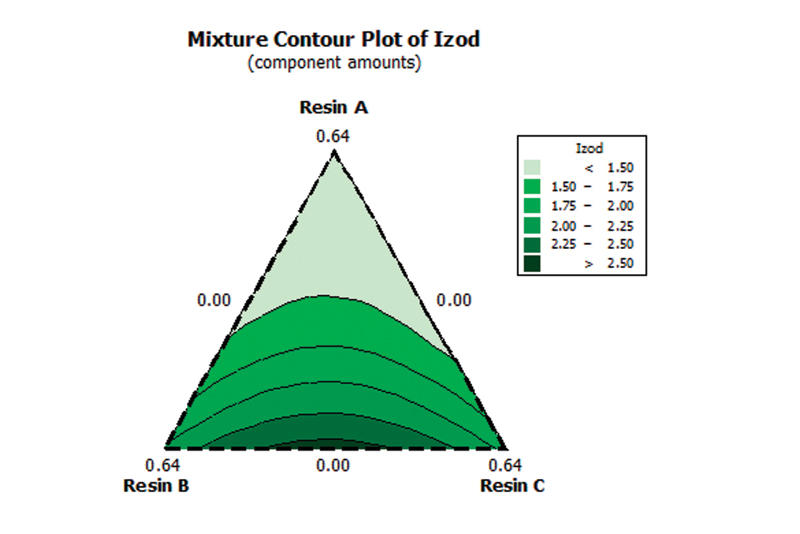
Figure 1: Response surface plot of notched Izod impact for trials 1 through 8.
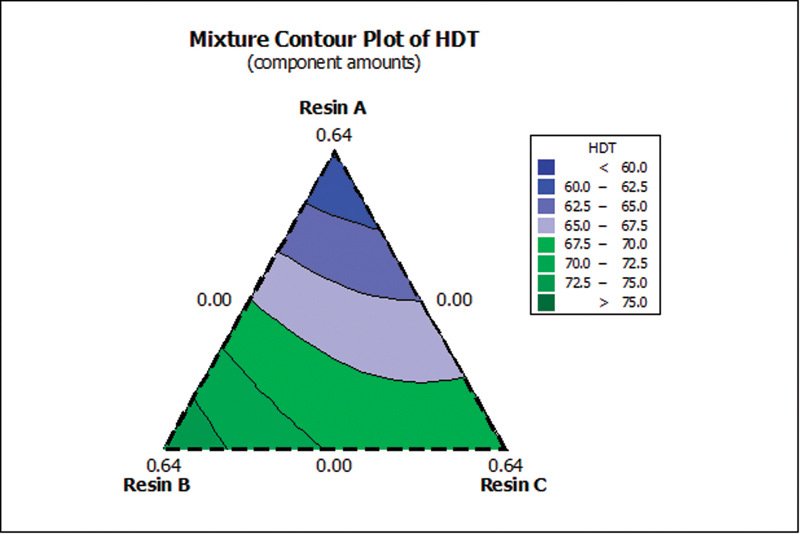
Figure 2: Response surface plot for heat distortion.
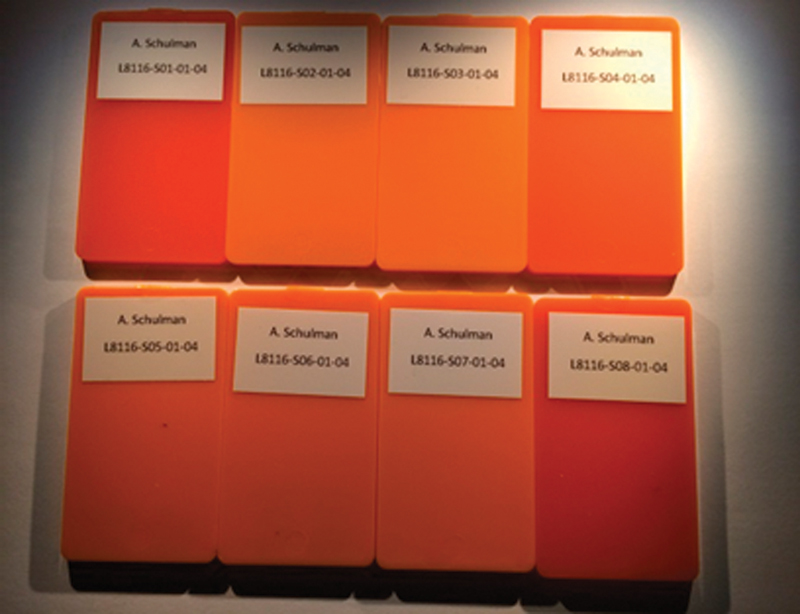
Figure 3: Shows the visual color differences between trials.
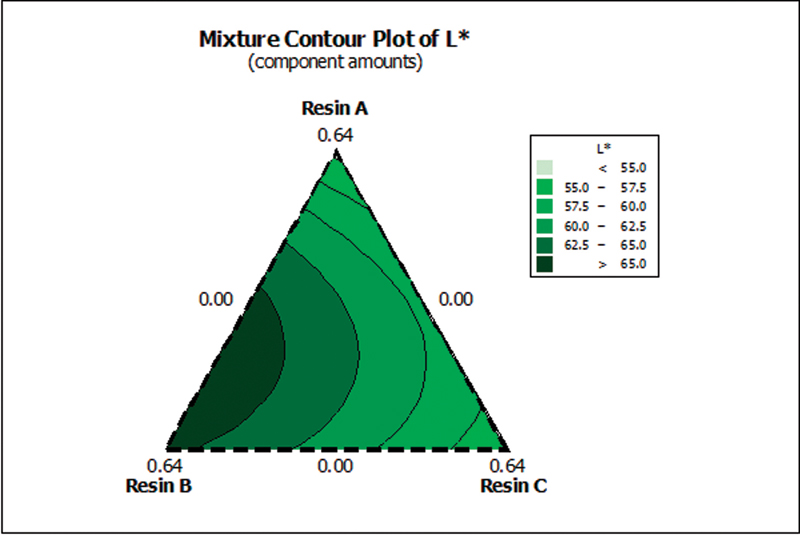
Figure 4: Response plot for L* before weathering.
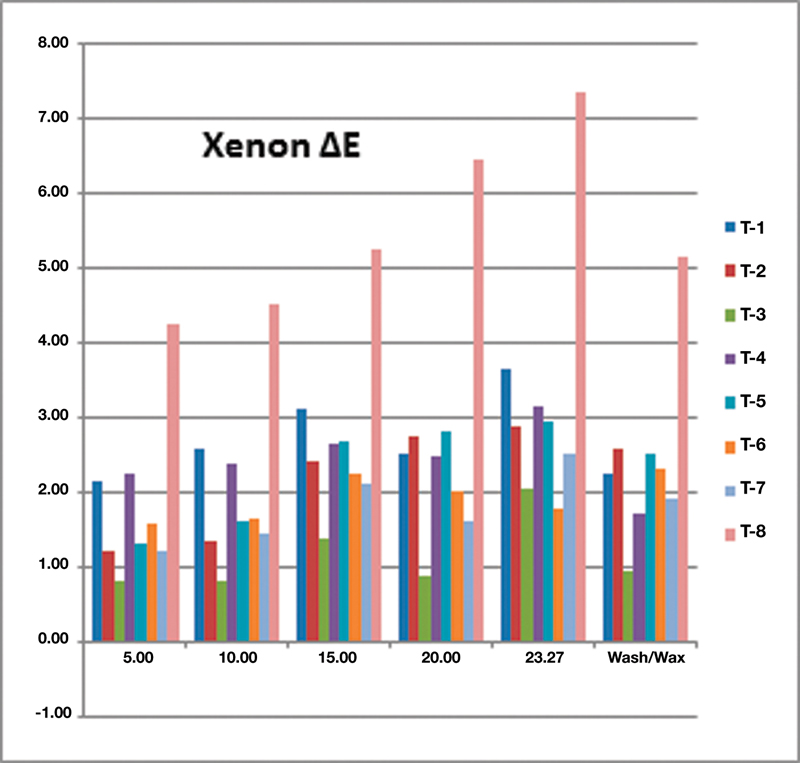
Figure 5: Xenon ΔE weathering results.
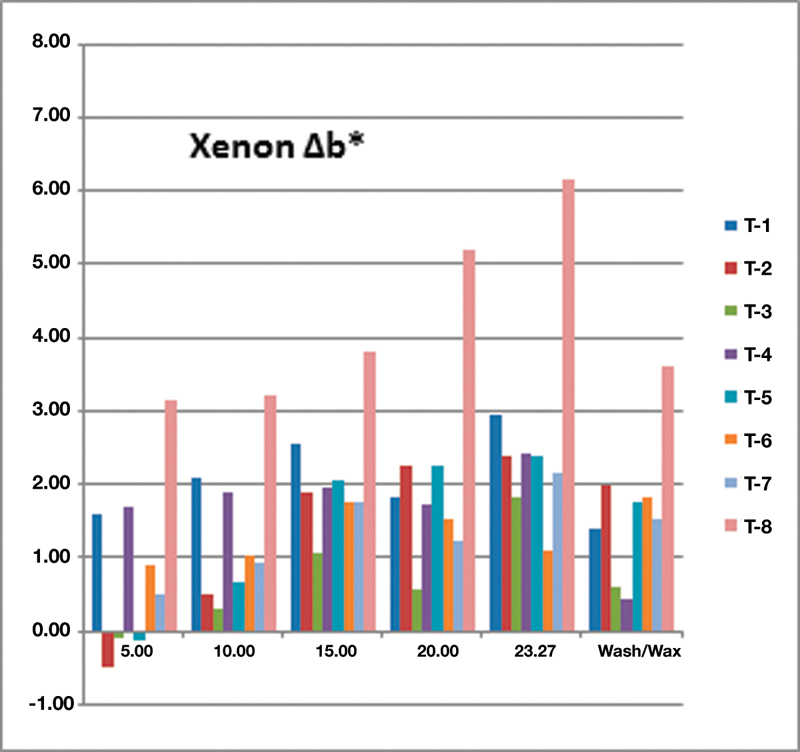
Figure 6: Xenon Δb results.
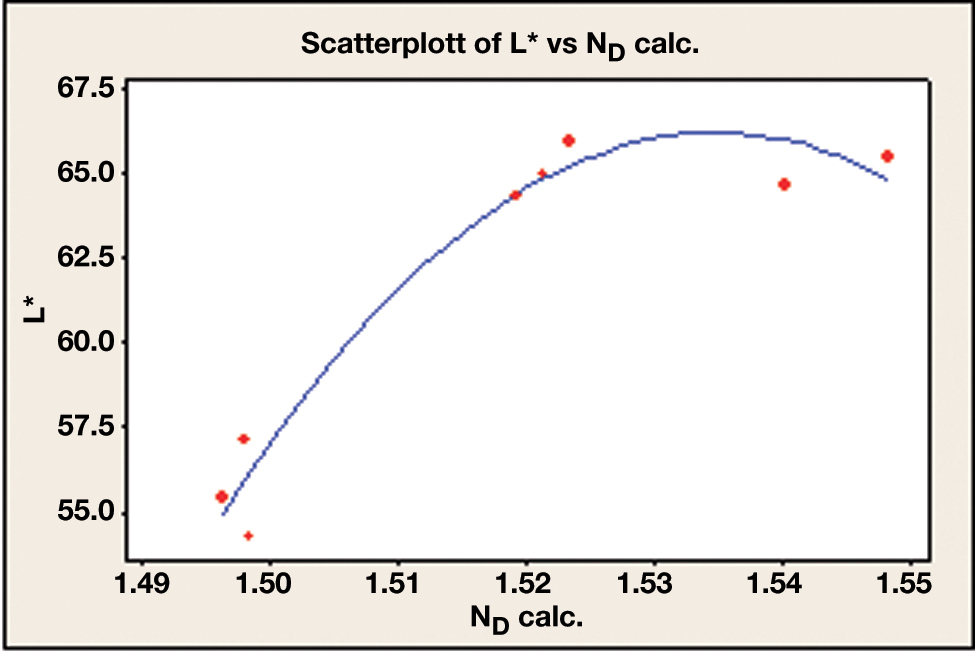
Figure 7: Scatterplot of L* versus the calculated ND.

[Ed. note: This is an abridged version of the author’s ANTEC® Orlando 2015 paper.]
ASA (acrylonitrile-styrene-acrylate) polymers were developed in the late 1950s, and had to overcome the UV (ultraviolet light) weaknesses of ABS (acrylonitrile-butadiene-styrene) by replacing butadiene with more UV-resistant acrylate monomers, leading to many U.S. and foreign patents.
A great deal of engineering goes into designing ASA rubber intermediates for impact, particle size, and performance characteristics that ultimately affect the final ASA refractive index. In general, ASA rubbers are emulsion polymerized alkyl acrylate monomers containing low-level crosslinking that create a rubber particle “core” onto which styrene and acrylonitrile monomers are grafted to create a “shell” around the rubber particle.
ASA polymers possess inherent UV resistance, that when colored with light-stable pigments ASAs achieve long-term outdoor color retention without the need to paint, whereas similar pre-colored polymers such as ABS, HIPS (high impact polystyrene), or PVC (polyvinyl chloride) are more susceptible to dramatic color shifts accompanied by degradation and loss of gloss and other properties upon long-term UV exposures.
ASA polymers continue to experience growth in applications and markets that require long-term performance in outdoor applications. Many of today’s exterior ASA applications are trending toward highly chromatic, vibrant colors designed to maintain color in outdoor applications, thus eliminating painting.
Introduction
A polymer’s natural opacity directly affects its ability to achieve highly chromatic colors such as bright yellows, reds, oranges, greens, blues, and even jet black. The higher the opacity, the more “washed out” the resulting color. Several factors affect the opacity of ASA polymers: refractive indices of the formulation components, particle sizes of the pigments and rubber particles, and processing conditions during compounding.
The refractive index of the monomers, copolymers, ASA rubber intermediates, antioxidants and UV stabilizers, processing aids, etc. all affect the final observed opacity in the final ASA product. Small differences (Δ > 0.02) in refractive index between components impart haze. The objective is to balance the refractive indices with the physical properties requirements and still achieve the desired chromatic color. Table 1 shows the relative refractive indices and differences between several monomers and their copolymers.
The various monomers utilized in ASA possess significant refractive index differences (e.g., 1.460 to 1.590) that ultimately result in varying opacities. The objective, then, is to minimize opacity through the selection of materials that when blended minimize the refractive differences within the final ASA to achieve chromatic colors while maintaining properties and weathering performance. The Gladstone-Dale refractive index relation can be used to calculate refractive index for polymers utilizing the following equation:1,2
n = Σi øi ni(1)
where øi and ni are the volume fraction and the refractive index of the i-component (monomer), respectively. A modified version of this equation using weight fraction rather than volume fraction was used to calculate the theoretical refractive index for each base polymer, ASA rubber, the formulated resin blend, and the final ASA formulated blends, using each monomer’s refractive index. The intent is to validate a method for predicting the opacity of an ASA blend and its ability to achieve highly chromatic colors.
It is also important to validate the UV resistance of the colored ASA product to ensure its performance in the targeted application. Several accelerated weathering methods are used to test color and physical property retention, such as QUV and xenon and carbon arc. These results provide an approximation to the actual outdoor lifetime performance relative to actual outdoor weathering.
Experimental Formulation
Eight trials were designed to evaluate the opacity effects of formulation on the color intensity using an orange dye. Table 2 shows the formulation matrix and Table 3 shows the calculated refractive index values for the three resins and the ASA rubber used in this study. The total resin matrix was constant at 64% with the ASA rubber content fixed at 36%. Table 3 also shows the calculated refractive index differences between the calculated 100% resin blend and “neat” ASA rubber. ASA rubber compositions are a complex blend of refractive index materials: typically butyl acrylate (BA) and styrene and acrylonitrile (SAN). The ASA rubber used in these trials contained 50% BA core and 50% SAN shell.
ASA rubber type and content was held constant along with the additives, while varying the three resin (Resins A, B, and C) levels. One percent of orange dye was added to each trial. The additives consisted of antioxidants, processing aids, and UV stabilizers. The resulting absolute color values and visual observations represent an indirect measure of opacity variation.
A Leistritz 34-mm co-rotating twin screw extruder was used to compound the trials. The samples were dried in a desiccant drier and injection molded, and the physical properties were tested via ASTM standards for color, melt flow, notched Izod, heat distortion, and gloss.
Accelerated Weathering Testing
Each ASA trial was injection molded into flat chips and conditioned for 40 hours, and their L*, a*, and b* color values were read using the X-Rite Color i7 spectrophotometer with the D65-10 light source. The method chosen for xenon weathering was SAE J2527 using the Q-Sun Xenotest Chamber Xe-3 made by Q-Lab for a total exposure of 2327 kJ/m2. The 60° gloss was measured by a BYK Micro-tri-gloss meter at each interval. Table 4 shows the test conditions used.
Results
1.) Physical properties results
The formulation matrix defined the melt flow, impact, color, heat properties, and gloss. Impact properties are further determined by the ASA rubber content, particle size, and distribution within the matrix. Table 5 summarizes the physical properties for the eight trials below.
The response surface plot for the notched Izod impact values for the eight trials is shown in Figure 1. Some synergy is observed in ASA blends containing Resin B and Resin C, resulting in higher notched Izod values. Resin A hinders impact development.
The final trials’ heat properties are solely determined by the individual resins, i.e., the HDT for Resin B > Resin C > Resin A. Figure 2 shows the response surface plot for heat distortion for the eight trials.
The melt flow rate (MFR) affects the processability of ASA and is the net result of the base resin MFR: At 220°C/10 kg, Resin A (70) > Resin B (38) ~ Resin C (43). The observed trial MFR values reflect these initial high flows.
2) Color results (non-weathered)
The absolute color L*, a*, and b* values are measured on a color computer and define three-dimensional color in terms of light and dark (L*) versus the red and green (a*) versus the yellow and blue (b*) regions. Table 6 shows the L*, a*, and b* absolute color readings before weathering. Figure 3 shows the visual color differences between trials T-1(S01) through T-8(S08).
The response surface plot for the L* values versus the different resin blends for the orange dye trials is shown in Figure 4. This plot will later be related to the refractive index differences between the various trials.
3) Weathering results
The color stability of the ASA trials was determined by reading the L*, a*, and b* values at specific exposure intervals over the duration of this study. SAE-J2527 accelerated xenon weathering tests a broad UV spectrum, temperature cycling between 70°C to 38°C with spray cycles, and long-term thermal stability of the resins, pigments, and additives. The ΔE and Δb weathering results are shown in Figures 5 and 6 below.
Gloss measurement is an indirect measurement of surface characteristics, including crazing and additive migrations. Table 7 summarizes the final color values after 2327 kJ/m2 weathering results followed by gently washing and waxing the exposed surfaces. Washing and waxing the surface of the exposed samples removes any migrated additives from the exposure duration.
Discussion
The main focus of this study was to determine whether the colorability of ASA can be predicted using the modified Gladstone-Dale equation to calculate the intermediate refractive index of resins, the blended resins, the ASA rubber, and the final ASA product by summing the calculated refractive index for each polymer fraction.
Trials T-1(S01), T-4(S04), and T-8(S08) (Table 3) have the lowest calculated refractive indices that directly correlate to the highest chromatic orange colors. These three trials also showed the smallest nD difference between the calculated refractive indices of the resin matrix and the ASA rubber calculated refractive index. This is visually observed in Figure 3. Refractive index differences greater than 0.02 between polymers generally result in reduced transparency (i.e. increased opacity) resulting in a less chromatic orange color. Lastly, the lowest calculated nD of the final ASA blend further supports the accuracy in predicting the blend’s colorability.
Statistical analysis of the relationship between the calculated refractive index and the L* value is shown in Figure 7. Additional data points are needed to validate whether this relationship is linear or quadratic in nature, but a quadratic fit is the best at this time. This further supports the ability to predict the colorability of ASA by calculating the resulting refractive index of the ASA formulation using the Gladstone-Dale equation shown in Equation 1.
The measurement of absolute L* values also supports the calculated method for determining the relative colorability (i.e., opacity) of the final ASA. Table 4 shows the lowest L* values parallel the highest visually chromatic trials (S01, S04, and S08) that also numerically reflect the lowest inherent opacities (i.e., greater transparency) of the final ASA. Figure 4 shows the L* response to the formulations studied, noting lower L* values for blends containing Resins A and C. Both Resins A and C have refractive index values that are relatively close, whereas Resin B has the highest refractive index.
The chromaticity of the orange dye in these trials is characterized by the a* and b* values (Table 7). S01, S04, and S08 have the highest a* values and lowest b* values that numerically describe the orange color in terms of the red and yellow spectral characteristics, and the lowest L* values further characterize the highest chromaticity of the orange color.
Lastly, the UV resistance of colored ASA is critical to the end-use application performance. T-8 (S08) did not weather as well as the other trials. Chromatic colors are difficult to maintain in accelerated UV weathering studies. S08 is based solely on Resin C. However, S04 contains both Resin C and Resin A and shows exceptional color retention throughout the testing period. Also, S04 is one of the trials with the highest visually chromatic orange color. S01 and S04 had the most chromatic color initially and lowest ΔE values after weathering in this study. The gloss retention values after weathering were also high for S01 and S04.
The trials in this study were formulated to achieve a highly chromatic orange color with acceptable impact, high melt flow and acceptable heat distortion properties. Table 5 shows the physical property differences further reflected in Figures 1 and 2, showing their surface response characteristics. The notched Izod surface response plot shown in Figure 1 shows some synergy in trials formulated with Resin B and Resin C. However, no synergy is noted in Figure 2 for the heat distortion.
Trials formulated with Resin B had higher heat distortions than those formulated with Resin C or Resin A. The surface response plot of the heat distortion values reflects the inherent heat resistance of the different resins, since the ASA rubber content was fixed in all trials. However, the trials with the higher notched Izod and heat distortion values (S02, S05, and S07) were less chromatic than trials S01, S04, and S08. Trial S08 exhibited good chromaticity, impact, and heat properties, but poor weathering performance. Thus, the T-4 (S04) formulation achieved the best chromatic orange color, high melt flow, and acceptable notched Izod, with retained color and gloss after weathering.
Conclusions
This paper explored the value of refractive index in ASA formulation strategy to achieve chromatic colors. The Gladstone-Dale equation calculations for the refractive index of each ASA formulation were compared to their respective visual and L* values to determine their predictive validity. It was observed that the lowest calculated refractive indices for those ASA formulations studied directly correlated to the most highly chromatic colors and lowest L* values. Furthermore, utilizing the Gladstone-Dale equation offers the potential to predict the colorability of other amorphous polymer blend systems.
Acknowledgements
The author gratefully acknowledges Jayson Humble and Brian Struchen for their support and commitment to this project.
References
- Seferis, J.C. and Samnels, R.J., J. Polym. Eng. Sci. 19, 975 (1979).
- Wedgewood, A.R. and Seferis, J.C., Polym. Eng. Sci. 24, 328 (1984).