Rotomolding on a Roll
In this update of the author’s previous report last October,1 he shows how rotational molders are rebounding quickly from the recession
Previous Article Next Article
By Peter J. Mooney
Plastics Custom Research Services
Advance, North Carolina, USA
Rotomolding on a Roll
In this update of the author’s previous report last October,1 he shows how rotational molders are rebounding quickly from the recession
Previous Article Next Article
By Peter J. Mooney
Plastics Custom Research Services
Advance, North Carolina, USA
Rotomolding on a Roll
In this update of the author’s previous report last October,1 he shows how rotational molders are rebounding quickly from the recession
Previous Article Next Article
By Peter J. Mooney
Plastics Custom Research Services
Advance, North Carolina, USA
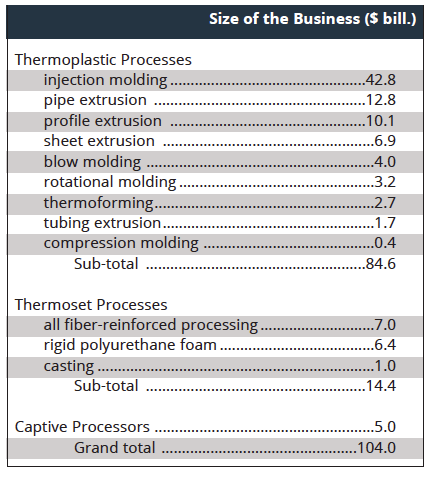
Table 1: The Value of Output of the Structural Plastic Part Processing Business, by Process, 2011
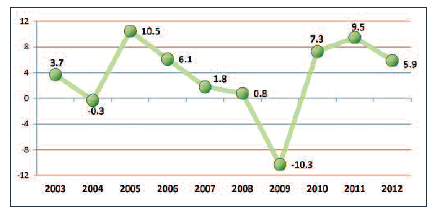
Figure 1: Trend of annual sales of a sample of N. American rotomolders, 2003-2012 (annual % changes)
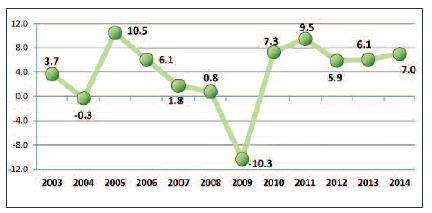
Figure 2: Trend of annual sales of a sample of N. American rotomolders, 2003-2014
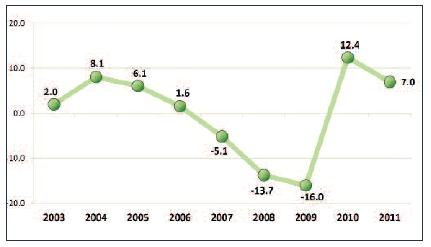
Figure 3: Trend in aggregate sales of all other regional structural plastic part processors, 2003-2011 (% changes)
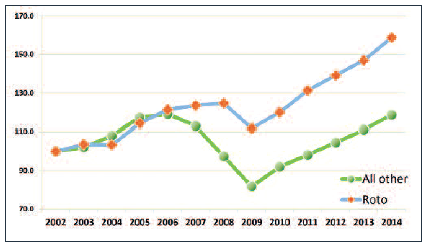
Figure 4: Comparison of the trend of annual sales of rotomolders and all other structural plastic part processors, 2002-2014 (index: 2002=100)
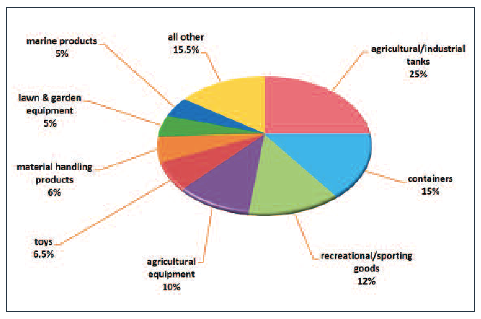
Figure 5: The distribution of markets for regional rotational molders (% share)

A recent research program2 generated estimates for the recent size and growth of the whole North American plastics processing business. The entire business was divided into two groups—namely, those processors producing non-structural parts and finished products (e.g., bottles, coatings, film) and those processors producing structural parts and finished products (e.g., appliance and automotive parts).
Both groups suffered setbacks during the Great Recession. However, what was intriguing was the fact that some processing groups managed to rebound fairly fast from this setback and resume their previous growth dynamic, whereas others lagged behind. Among the structural plastic part processors it was noticeable that rotomolders rebounded in a particularly robust fashion. Why might that be?
The Trend of N. American Rotomolder Sales: 2002-2012
In 2011 the value of output of the whole regional structural plastic part processing business was $104 billion, or 45% of the total value of output in regional plastics processing. Rotomolders’ sales constituted $3.2 billion, or roughly 3% of that total (see Table 1). I’ve researched and published several reports covering the North American rotational molding business—roughly every 3-4 years since 1995. The data and insights are gathered through telephone-based interviews with officials at rotomolders and their suppliers. (The annual surveys of regional rotomolders conducted by Plastics News are the other primary source; the magazine’s database yields a valuable time series of annual sales for over 100 rotomolders from 2002 to 2012.) In those cases where rotomolders have been acquired by other rotomolders, the sales of both companies were merged over the whole time period. In other cases where companies were active in 2002, yet exited the business prior to 2012, they were left in the sample; some other rotomolder(s) must have picked up their work. Companies reporting in some years, but not in others, were left out. The objective was to create a trend-line of sales for a representative sample of regional rotomolders over the whole 13-year time period.
In 2002 these 100+ companies registered aggregate sales of $1.5 billion; by 2012 that total had increased to $2.1 billion. The size of the whole North American rotational molding business as of 2012 was probably of the order of $3.4 billion. If that’s the right magnitude, this sample captures about two-thirds of all rotomolder sales across the region.
Figure 1 portrays annual percentage changes in the aggregate sales of these 100+ rotomolders from 2002 to 2012. They sustained a slight sales dip in 2004, yet sales boomed in 2005. Then the growth rate steadily slackened from 2006 right through 2009 as the pre-conditions for the Great Recession were forming. However, their sales bounced back strongly from 2010 through 2012. In fact rotomolders recovered faster than all the other structural plastic part processors. This claim will be verified below.
The Trend of N. American Rotomolder Sales: 2013-2014
We needed to update this trend-line to 2013 and 2014. So in April, we conducted a telephone-based survey of officials at over 100 U.S., Canadian, and Mexican rotomolders. Officials at 53 companies (roughly half the sample) participated in this survey. The survey questionnaire was mercifully brief: The officials were asked if their company’s sales in 2013 had gone up, gone down, or stayed the same. They were then asked if their 2013 sales had gone up or down by 0-5%, 5-10%, or 10% plus.
What’s remarkable is the large number of companies (18) reporting 2013 sales growth of 10% or more. In many cases the sales improvement wasn’t simply in the teens; it was 20%, 30%, and, in one case, 300%. The second largest number of companies (11) reported sales improvements of 5-10%. Some (7) experienced lost sales. The average percentage change among these 53 companies was 7.4%—much better than the 5.9% growth registered in 2012.
The officials were then asked about the likely trend of sales here in 2014. Their responses were quite similar to those for 2013. Once again the largest number of rotomolders (18) expected 2014 sales growth greater than 10%. There were fewer officials (3) anticipating lower sales this year. Some cited modest sales growth of 0-5%. The average expected sales growth among these 53 companies is 7.7%—slightly better than the 7.4% in 2013.
These average percentage changes for rotomolder sales in 2013 and 2014 were calculated by simply adding up all the percentage changes reported by the officials and dividing the total by the number of responses. Another way of estimating overall sales growth would be applying the percentage changes in sales in 2013 and 2014 to the 2012 sales of each company—in effect weighting the percentage changes by the size of the companies. Taking that approach you arrive at 6.1% sales growth in 2013 and 7.0 % sales growth in 2014. Adding these 2013 and 2014 changes to those in Figure 1, the trend line for 2002-2014 in Figure 2 emerges.
If these estimates for rotomolder sales growth in 2013 and 2014 are reasonably accurate, this suggests rotomolders have experienced a strong, steady rebound from the Great Recession. From 2009 to 2014 their sales will have grown by 7.2% on average.
Comparing Sales Trends, 2002-2014
How does the rotomolders’ recent sales trend compare to that experienced by all the other structural plastic part processors? Figure 3 portrays annual percentage changes in the collective sales of 280 companies producing structural plastic parts by means of blow molding, injection molding, pipe/profile/tubing extrusion, sheet extrusion, and thermoforming over the period 2003-2011.
This group of plastics processors experienced strong sales growth from 2003 to 2005. Signs of weakness appeared in 2006, and that was followed by three straight years of sales declines. The cumulative change from 2006 through 2009 was a loss of 31.2%. Over the whole nine-year period the average annual growth rate achieved by this group of companies was effectively zero. And that’s in nominal (sales) terms; in real (volume) terms they suffered a significant collective loss. By 2011 sales of this group of companies were still 17.3% below those of 2006, five years earlier. It would take three more years of more than 5% average annual growth to regain their previous peak sales—altogether eight years of recovery.
Figure 4 contrasts the trend of rotomolders’ sales to those for all the other structural part processors from 2002 to 2014. These are indices of sales for the two groups. (Note: I only had data for sales of all the other structural plastics processors out to 2011; an average annual growth rate of 6-7% for this group from 2012 to 2014 is assumed.)
The Secret of Rotomolders’ Success
Why would it be that rotomolders rebounded from the Great Recession faster than all the other structural plastic part processors? If you ask rotomolders and their suppliers this question, the answer would be that rotomolders have a more diversified customer base. They also capture more new product development projects as OEMs emerge from tough times. Initial volume of production runs are low, so rotomolding is an ideal option with its low-cost tooling.
One official consulted summed up rotomolders’ competitive advantage very succinctly: “Rotomolders are entrepreneurs selling to entrepreneurs.” That’s a general observation. Let’s be more specific.
Let’s examine the rotomolders’ primary end-use markets. In 1995 toys were the dominant market; they constituted 40% of the total business. Little Tikes was the largest rotomolder—not only in North America, but in the world. There were other regional rotomolders producing toys. Since 1995 much of the regional toy business has been lost to China—rotomolded toys, injection molded toys, blow molded toys, and so on. So domestic rotomolders had to either create new markets or penetrate existing markets in order to replace those lost sales.
Another major market for rotomolders was kayaks. A lot of rotomolders piled into the kayak business; by the mid-2000s there were over 50 U.S. and Canadian rotomolders producing kayaks either on a custom, proprietary, or captive basis. Other plastics processors (e.g., composite processors and thermoformers) entered this booming business. Eventually the kayak market became saturated, and rotomolders had to seek new growth markets once again.
Today the dominant market for regional rotomolders is large agricultural and industrial tanks. They account for 25% of total sales. And beyond tanks, rotomolders have continued to be entrepreneurial, developing their own proprietary products, and penetrating applications previously the preserve of other structural plastic part processors. This includes agricultural equipment, material handling products, marine accessories, and so on.
Conclusion
The conclusion one draws from this analysis is that rotomolders in this region are riding the wave of a rebound in the demand for durable consumer and industrial manufactured goods coming out of the Great Recession. However, they mustn’t rest on their laurels. They must continue to preserve and enhance every advantage they have in product design, pricing, and performance in order to continue competing successfully in the structural plastic part processing business. By the end of this decade the pie-chart in Figure 5 should include whole new markets and applications for rotomolders in this region.
References
- Mooney, P.J., “Regional Rotomolders Ride the Storm,” Plastics Engineering, October 2013, pp. 28-32.
- “The Size and Growth of the North American Plastics Processing Business,” PCRS, August 2013.
About the author:
Dr. Peter J. Mooney is principal of Plastics Custom Research Services (PCRS), of Advance, North Carolina, USA. He researches and publishes multi-client plastics industry reports and conducts custom research programs. PCRS’s (August 2013) report, “The Size and Growth of the North American Plastics Processing Business,” is available via www.plasres.com.