The 2012 Magazine Manufacturing and Production Technology Survey
ALTHOUGH SATISFACTION WITH TRADITIONAL, PRINT-CENTRIC PRODUCTION TECHNOLOGIES REMAINS HIGH, THE VERDICT IS LESS ENTHUSIASTIC FOR DIGITAL CONTENT, XML, AND AD DELIVERY SYSTEMS. CAPITAL INVESTMENT HAS STILL NOT RETURNED TO PRE-RECESSION LEVELS, AS MANY PUBLISHERS APPEAR TO BE TAKING A WAIT-AND-SEE APPROACH.
BY JOHN PARSONS


For many years, FOLIO: and Readex Research have conducted a survey of magazine production professionals—noting their preferences and tendencies on the subject of creating a fi nished product. This year’s survey contained a few new questions, mainly about technologies for producing digital content, as well as some new measurements of user satisfaction.
As the magazine industry struggles with technological and fi nancial chaos, it is important to hold the proclamations of industry pundits (including this writer) at arm’s length, and look for data supporting actual change. This decade may become the beginning of a mobile publishing era, but print is still the dominant medium, and the tools for creating non-print content are very much in their infancy. Technology developers still have a long way to go in creating tools for tablet and smartphone content that rival those of print production.
It should be noted that the total number of respondents in 2012 was smaller than in previous years—169 compared to 224 the previous year. Of those respondents, 25 were excluded as being from organizations that did not publish magazines, leaving a total of 144. However, we believe that meaningful trends can be discerned from the data. The total is still a respectable 14.4 percent of the original 1,000 member sample, with a margin of error of ±7.7 percent at the 95 percent confi dence level. Many of the respondents’ defi ning characteristics—such as the percentage of consumer versus business-to-business publishers or combined revenue fi gures—are consistent with previous years. So long as truly minor shifts or differences (i.e., those within the margin of error) are ignored, there is plenty of signifi cant data to discuss.
Respondent Characteristics
Over 36 percent of all respondents indicated that their organization publishes b-to-b magazines, while almost 34 percent indicated that their organization publishes special interest or mass market consumer magazines. Multiple responses, including association/journal/ newsletter (27 percent) and city/ regional (10 percent) were allowed, so the total was greater than 100 percent.
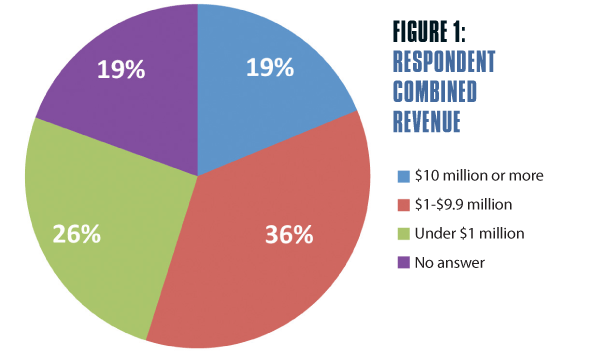
Of the 144 respondents who publish magazines, slightly fewer than 19 percent reported over $10 million in combined revenue for their respective organizations. The largest segment, about 36 percent, reported between $1 million and $9.9 million, while fewer than 26 percent reported less than $1 million (Figure 1).
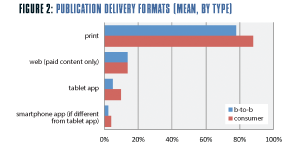
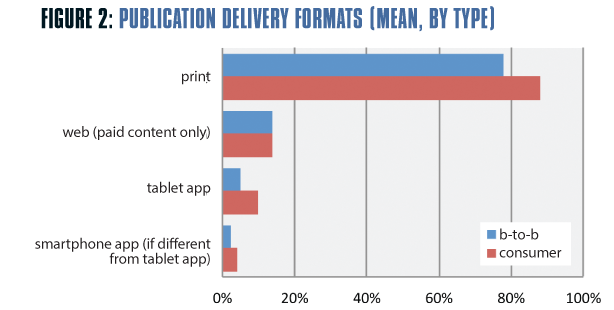
Only about 42 percent of all respondents reported that their paid magazine subscriptions were delivered entirely in print, while over 24 percent reported that between 75 percent and 99 percent were so delivered. The mean percentage for print delivery was 78 percent for b-to-b print content and 88 percent for consumer print, compared with 14 percent for paid Web content of either type (Figure 2).
Mean percentages do not tell the whole story. Slightly more than 22 percent of all respondents reported some level of paid Web content delivery— between 1 percent and 24 percent, to be exact—which was offset by the 46 percent who reported none. A similar issue existed with tablet apps, with almost 15 percent reporting between 1 percent and 24 percent of paid subscriptions from that format, offset by the 64 percent who reported none. The data support the notion that digital delivery has a revenue potential which has yet to be fully realized.
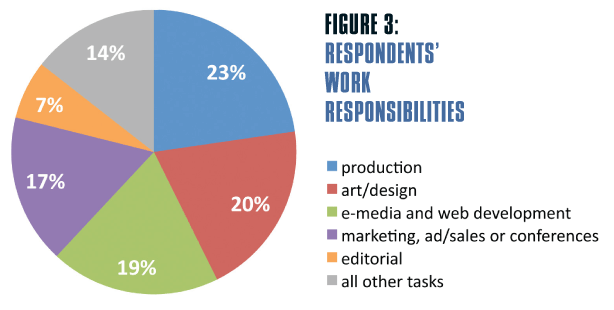
The respondents carried out a wide array of job responsibilities—often fi lling more than one role. Of the 436 total work area responses, production was the most often cited, at almost 23 percent. Art/design and various digital media tasks were next, at 20 percent and 19 percent, respectively (Figure 3).
About 65 percent of respondents reported their organization has a publication designer/art director that also does production work. This number has been fairly consistent over the years. It is also somewhat higher for b-to-b (66 percent) than it is for consumer magazines (55 percent).
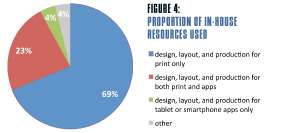
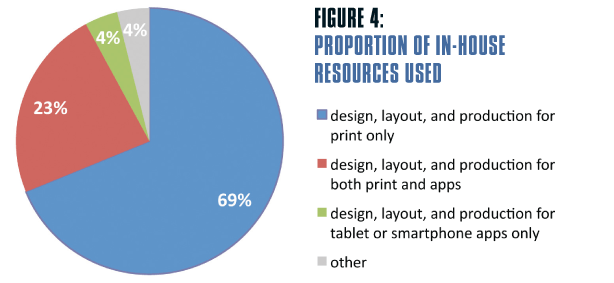
Regardless of how the respondents described their work responsibilities, the proportion of in-house resources devoted solely to print was substantial, at about 69 percent. Close to 23 percent reported in-house resource allocation to a combination of print and app production, while app-only work garnered only 4 percent (Figure 4).
In future surveys, we will dig deeper into job responsibilities and resource allocation as it pertains to production realities. With many of the tablet app-creation tools requiring the resource equivalent of an entirely new publication—at least at launch—it will become increasingly critical to know how such resources are best used, and how production systems can relieve the overload.
Investment Trends
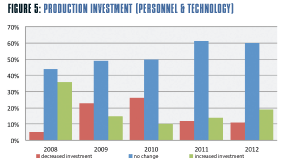
Respondents were asked to consider their company’s annual investment in the production department —including both personnel and technology— and compare it with the previous year. The percentage of those reporting increased investment was about 19 percent, up very slightly (within the margin of error) from the 2011 survey response of 14 percent. The percentage reporting no change remained about the same (60 percent), while those reporting decreased investment hovered around 11 percent. The spike in decreased spending coinciding with the recession seems to have abated, but overall spending increases are still far short of 2008 levels (Figure 5).
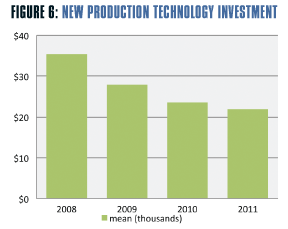
Another trend is the progressive decline in reported investment in new production technology. The mean value dropped from $35.4 thousand in 2008 to $21.8 thousand in 2011 (Figure 6). Allowing for the margin of error, plus the fact that about 35 percent reported no new investment in each of the four years, the data seem to indicate a conservative, wait-and-see attitude.
While new hiring may explain some of the modest increase in production department investment, the fact remains that new technology has not yet made the impact that one would expect from the rise of tablets. While the potential engagement and revenue growth of this channel is not seriously questioned, the data show that they have not yet accelerated production budgets.
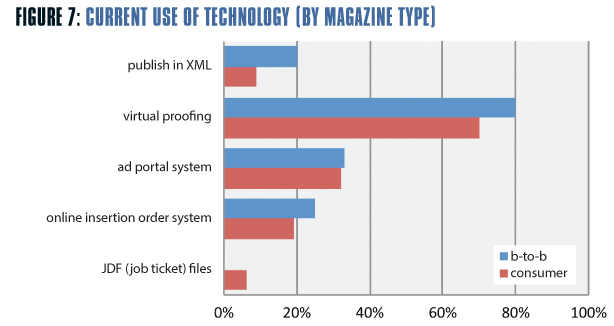
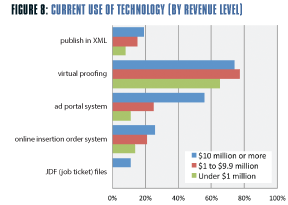
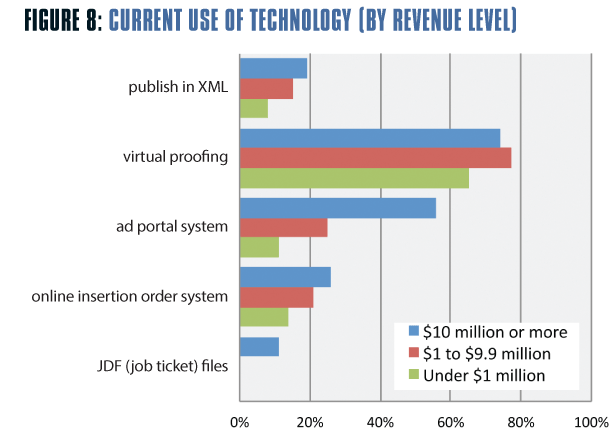
Specific Production Technologies
For the past few years, the survey has asked whether respondents’ companies are currently using various digital technologies. We broke down the “yes” responses according to whether the respondent’s company published b-tob or consumer magazines (Figure 7), as well as by level of combined revenue (Figure 8). In general, b-to-b magazines claimed a greater degree of use of all technologies, except for the use of job ticket files in the Job Definition Format (JDF) first introduced in 2000. The difference was greatest for virtual proofing, with 80 percent of b-to-b magazines reporting its use, compared with 70 percent of consumer magazines. Using revenue levels to analyze technology adoption reveals a typical distribution, with bigger companies making correspondingly bigger investments. The only exception to this was in virtual proofing, where magazines with revenues between $1 million and $9.9 million reporting slightly higher adoption than their richer counterparts. The very high popularity of ad portal systems among companies with revenues of $10 million or more is worth nothing, as is the non-existence of JDF use by magazines making less than $10 million.
Publishing in XML, an often-mentioned topic at conferences, does not seem to be getting much traction, with an overall response of only 15 percent of those surveyed— down from an average of 20 percent during the previous four years. While this number may be influenced by the low number of respondents this year, it is at least fair warning that XML publishing has stalled. This may well be due to the structural requirements of XML itself, which is better suited to predictable, structured content, and less so for creative, design-driven publications.
Virtual proofing is by far the most widely-accepted technology named in the survey, with about 73 percent of all respondents claiming current use. This is very consistent with previous surveys. Of those using the technology, the mean starting point was four years ago, and the mean annual savings is $48.9 thousand—up significantly from previous years. The data suggest that virtual proofing has become a mainstream technology. Except for covers, costly physical proofs have all but disappeared from the editorial side of many magazines. Advertising is less likely to let go of the contract proof security blanket. However, cost and time factors—plus improved color management—will ultimately push most advertisers into the all-digital world.
Ad Portal Systems
Ad portal systems, defined as “a system that allows advertisers to digitally send ads to your organization by dragging PDFs to a portal icon on their desktops,” have achieved modest success, with 28 percent of all respondents affirming their use. Both use and mean annual savings ($62.5 thousand) have risen steadily over the past five years. Part of the resistance to such systems has been the lack of predictability and uniformity of PDF files in general. Problems like incorrect page size, inadequate bleed, low-resolution images, and the like can make automatic drag-and-drop an untenable proposition. Automated file preflight can often allay these fears, but it will take time for technology
Online Insertion Order Systems
Online insertion order systems, defined as “a system where advertising orders can be sent to and managed by your organization electronically,” have remained the same, at about 21 percent. The claimed mean annual savings of only $32.5 thousand may be due to the low number of respondents using such systems. For advertisers and publishers with adequate IT resources, such systems are a logical, albeit sometimes complicated solution. The fact remains, however, that integrating accounting with magazine production is not often a realistic short-term goal.
JDF Files
JDF files were by far the least-used technology of all those surveyed, with only about 3 percent responding in the affirmative. This may be explained by a separate survey question, asking respondents to specify the method of sending its final magazine layouts to the printer. Over 53 percent indicated they used a supplier’s proprietary upload system, such as R.R. Donnelley’s InSite portal. Almost 37 percent said they used FTP, with about 10 percent using other methods, such as email attachments. Since job tickets are a production-specific technology, it may be safe to assume that magazine publishers may simply be submitting files without knowing (or caring) whether JDF is used or not.
The low numbers for some of these technologies may be due to the lack of a clear “aha moment,” or simply to inertia and the need to simply survive. We will continue to track most of these—plus emerging technologies on the app creation side—to gauge whether or not developers are on the right track.
Satisfaction levels
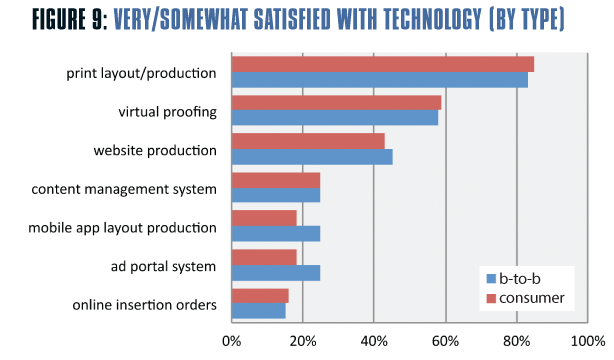
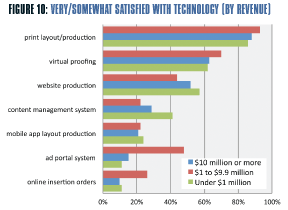
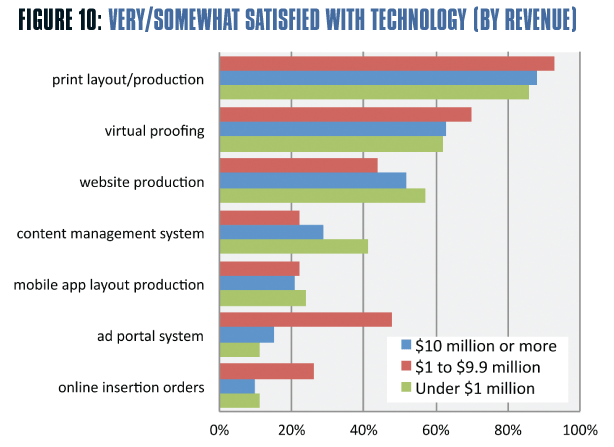
A new question in this year’s survey dealt with respondent satisfaction—and dissatisfaction— with existing production technology. As with the adoption question, we used magazine type (Figure 9) and revenue level (Figure 10) to show how each technology fared with respondents.
Not surprisingly, print layout and production technology ranked highest among respondents, with only minor differences based on magazine type and revenue level. Virtual proofing and website production technology ranked second and third. The latter is remarkable only in the fact that companies with revenues of $10 million or more indicated they were very or somewhat satisfied less often (44 percent) than companies with revenues under $1 million. Arguably, this may be due to the maturity of tools for creating simple websites (i.e., Dreamweaver) and the relative chaos of Web content management used to create more complex publisher sites.
The same perception skew was reflected in respondents’ satisfaction with content management systems in general, with only 22 percent of respondents from $10+ million companies indicating they were very or somewhat satisfied, and 41 percent of respondents from under $1 million companies saying so. Again, this may be due to the different features, perceptions, and expectations surrounding systems designed for large and small companies.
Ad portal and insertion order systems received higher-than-average satisfaction ratings among respondents from companies with $10+ million revenue, at 48 percent and 26 percent, respectively. This makes sense, given the fact that such companies indicated higher-than-average use.
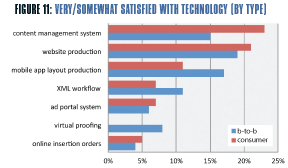
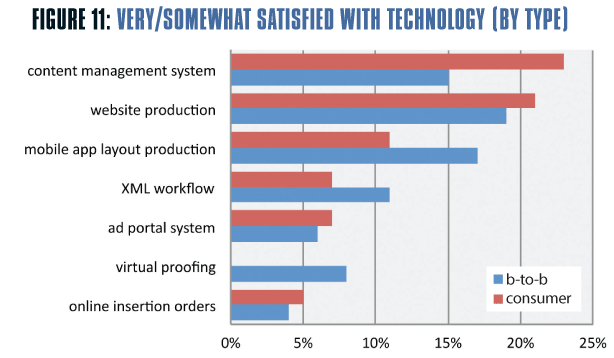
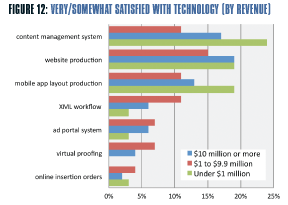
Respondents’ dissatisfaction with technologies was to some degree a mirror of the satisfaction rankings, with some interesting exceptions. In Figure 11, we see that mobile app layout production technology received a higher percentage of very or somewhat dissatisfied response among respondents at consumer magazines (17 percent) versus that of b-to-b magazines (11 percent). When seen through a breakdown of revenue levels (Figure 12), the very or somewhat dissatisfied response was much higher for companies with under $1 million in combined revenue (19 percent) than it was for companies reporting higher revenue. This may be due to the fact that, until recently, app creation tools tended to favor larger publishers with more resources.
It should be noted that a significant number of respondents were neutral or checked “not applicable” for some technologies, including content management, mobile app production and XML. The above analysis of outliers in these areas is useful, but should not distract us from the fact that certain technologies are still far from being mainstream.
Conclusions
Perhaps one of the more telling results of the survey can be gleaned from the verbatim responses to the question, “What technology has had the single biggest positive impact on your magazine production?” The greatest number of responses (24) had to do with Adobe desktop software, notably InDesign. The next most frequently cited technology was online or virtual proofing (16) followed by PDF or Acrobat (10). These technologies are largely but not exclusively centered on the production of a printed page.
While respondents have certainly begun to produce non-print content, the “aha moment” comparable to PageMaker or QuarkXPress in the 1980s has not yet occurred. Enabling technologies such as content management still have significant negative user perceptions.
In the realm of practical, cost-effective production, the printed page revolution that began with Ready Set Go and PageMaker and concluded with InDesign is largely over. The digital content revolution has barely begun. ![]()