Consolidating Data
Access Intelligence achieves cross-system efficiencies with data visualization tool.
Consolidating Data
Access Intelligence achieves cross-system efficiencies with data visualization tool.
![]() ne of the key issues in media today is the ability to pull insights from the massive amount of data we capture on our various platforms.
ne of the key issues in media today is the ability to pull insights from the massive amount of data we capture on our various platforms.
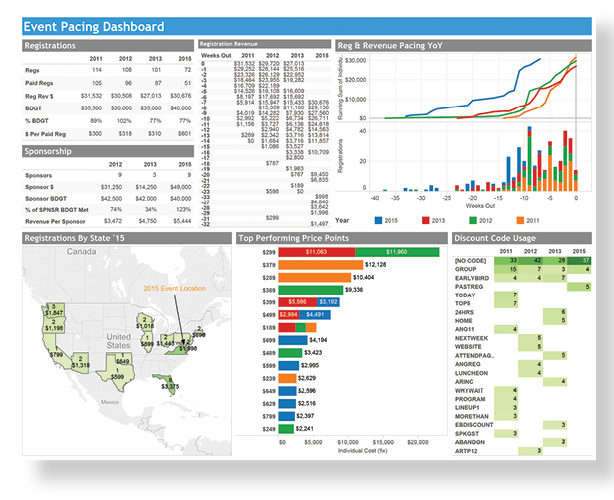
We recently invested in Tableau, which is a business intelligence and data visualization tool, to help us solve this problem. Tableau sits in the center of—and connects to—all of our various data repositories. These include our event registration systems, Salesforce.com, Google Analytics, our email provider, our fulfillment systems, and our social media feeds.
All of these have reporting capabilities but they are siloed in those individual systems. And when you look at data from just one system, you don’t get the full picture. Tableau reaches into those systems, merges and normalizes the data, and then provides us with both high level and detailed reporting. Tableau allows us to find insights into our audience in a matter of hours instead of weeks. We are spending less time organizing the data and more time analyzing.
We are finding nuggets of information that are making us more proactive. For example, we can report how someone’s email or web behavior might be increasing or decreasing their chances of attending an event. Or how a sponsor may be shifting money to other platforms. It has almost become an early warning system for us, but is also showing us where there are some causations in the data where before we were just looking at correlations. ![]()
—James Capo, vice president, digital services, Access Intelligence