Get More than Cavity IDs from Your Cavity IDs
Apply an understanding of plastic flow when marking mold cavities
Previous Article Next Article
By David A. Hoffman Beaumont Technologies, Inc., Erie, Pennsylvania, USA
Get More than Cavity IDs from Your Cavity IDs
Apply an understanding of plastic flow when marking mold cavities
Previous Article Next Article
By David A. Hoffman Beaumont Technologies, Inc., Erie, Pennsylvania, USA
Get More than Cavity IDs from Your Cavity IDs
Apply an understanding of plastic flow when marking mold cavities
Previous Article Next Article
By David A. Hoffman Beaumont Technologies, Inc., Erie, Pennsylvania, USA
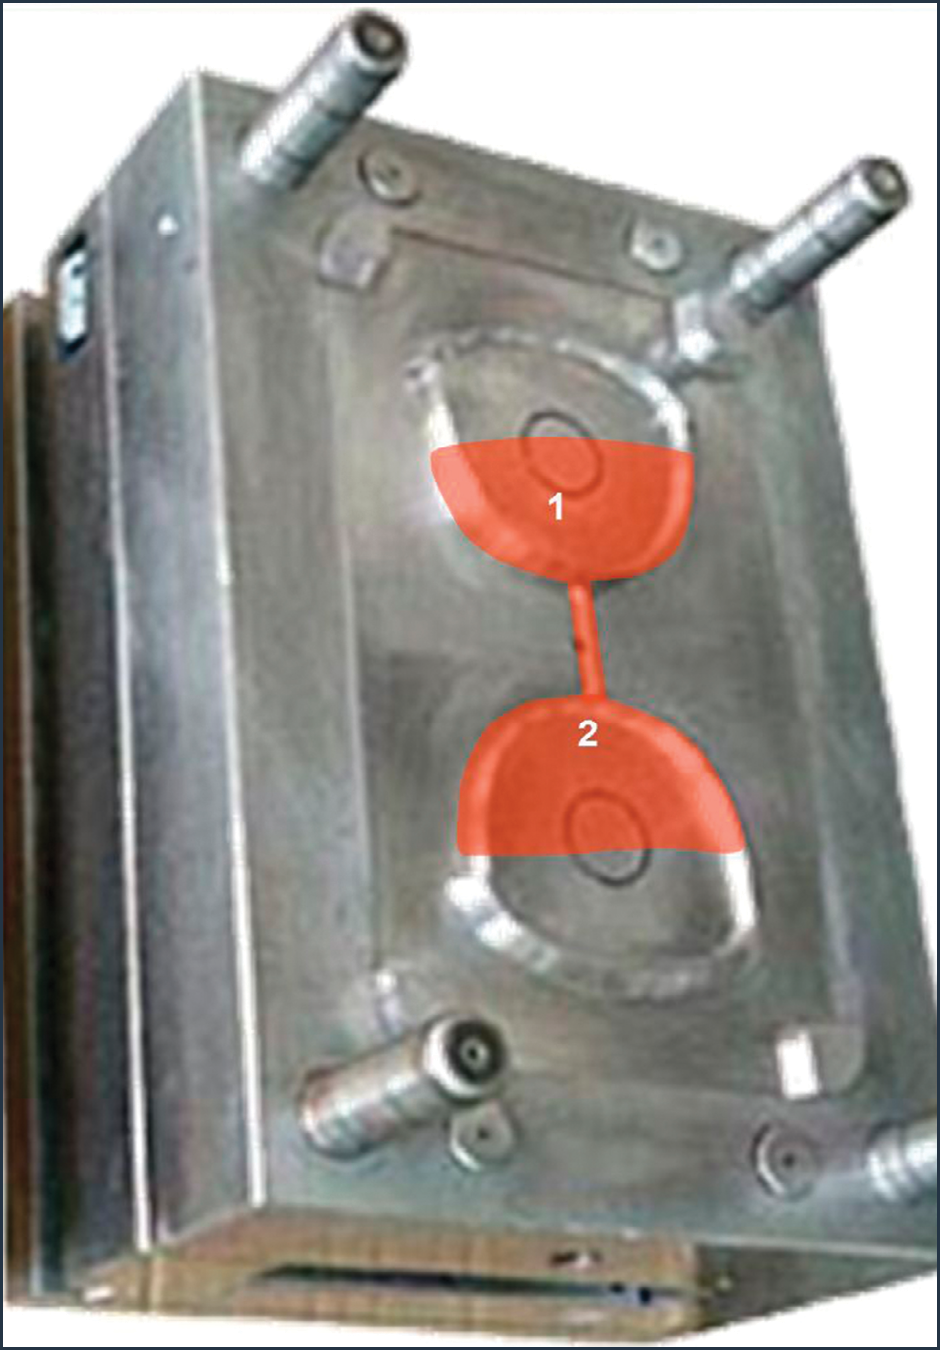
Figure 1: It’s best to place cavity IDs (“1,” “2”) as close to the gate as possible to provide the best chance of seeing them on parts when analyzing short shots (in red).

Figure 2: Cold runner system with gate ID markings.
Figure 2: Cold runner system with gate ID markings.
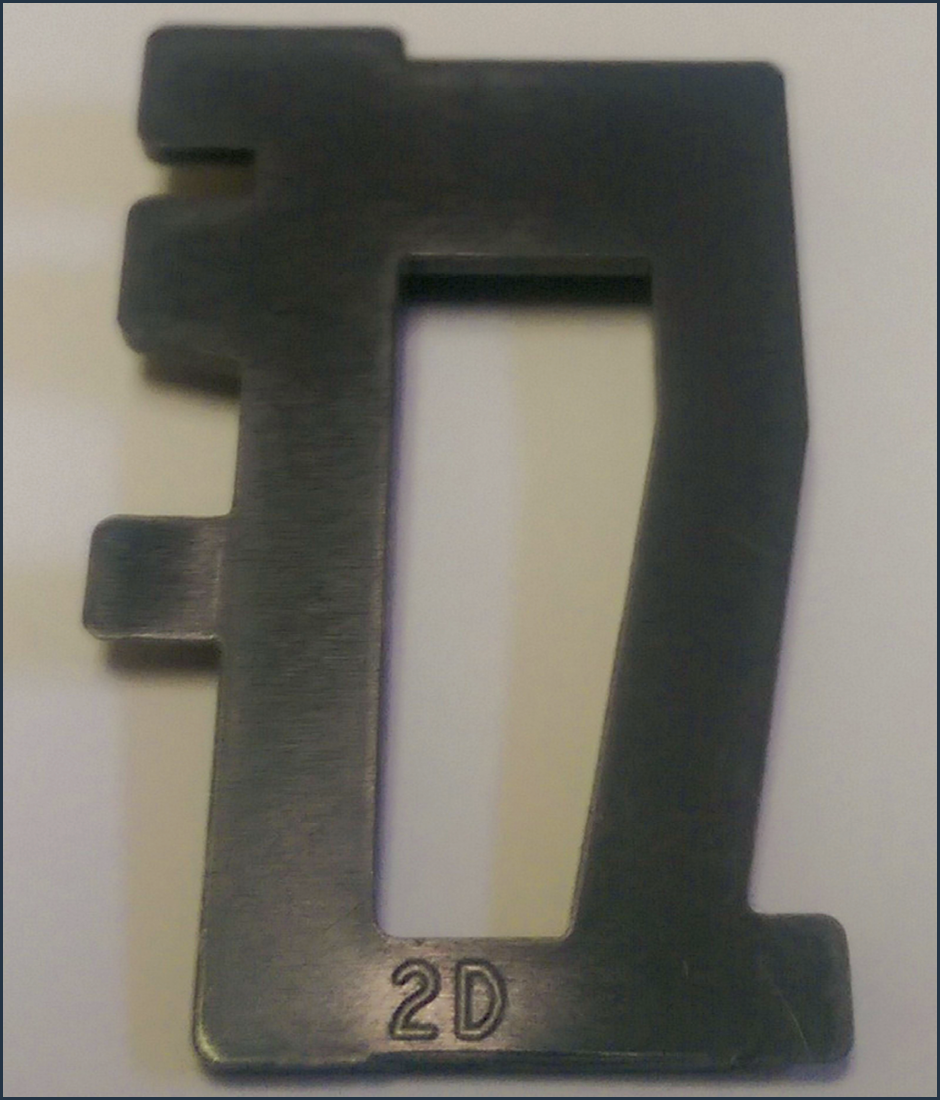
Figure 3: A part with an ID of “2D,” which means it’s part of Flow Group 2 and is located in Region D of the mold.

Figure 4: A 16-cavity example of short-shot data collected and graphed using a conventional cavity ID numbering system.
Figure 4: A 16-cavity example of short-shot data collected and graphed using a conventional cavity ID numbering system.

Figure 5: Figure 4 rearranged according to Flow Group IDs and Regions.
Figure 5: Figure 4 rearranged according to Flow Group IDs and Regions.
[Note: You can also check out the author’s first contribution to this series of articles on pp. 28-31 of the November/December Plastics Engineering.]
Cavity identification markings (cavity IDs) are used to distinguish one cavity from another. This is important to help provide traceability for such things as part quality, mold maintenance issues, and short-shot imbalance data.
The markings used and their respective locations are typically put into a mold without much thought. The first company I worked for would use +, -, /, *, and other symbols, with an actual numbering system eventually working its way into our standard operating procedure. As for which cavity would be number “1” and so on, sometimes we would start in one corner of the mold and go around clockwise. Other times we would go up and down or left to right, and yet other molds would not have any pattern at all. The thought was that as long as there is an identifying mark on the cavity somewhere, then the purpose was met. In this article we’re going to take a second look at this relatively simple aspect of a mold.
Four Key Points
The first important point we want to make concerns the location of the ID markings within the cavity itself. Our recommendation would be to place the cavity IDs as close to the gate as possible. The reason for this suggestion is simple: It will give you the best chance of actually seeing the cavity IDs on the parts when performing a short-shot analysis (Figure 1).
A second important point to make is to avoid putting cavity IDs on ejector pins, if possible. The reason for this is that pins tend to get moved around during routine mold maintenance, and what was once cavity 3 may now be cavity 6. This makes the data less useful when trying to look at historical trends and patterns.
A third point applies only to molds that contain any portion of a cold runner system. In this case, we would recommend adding a “gate ID” to the cold runner system. A gate ID should be placed at each gate, and the marking used should be the same as the cavity ID to which the gate is attached. For example, if your cavity ID is “8,” then the gate ID for the gate feeding that cavity should also be marked with an “8” (Figure 2). This way you know which gate is feeding which cavity. This additional reference marking is useful when trying to look for quick correlation between the molded runner system or mold orientation versus short shot or part quality data.
Additionally, if you utilize gate inserts in your molds, be sure the gate ID is located on the gate insert itself and that it stays in its correct location during routine mold maintenance. If you move gate inserts around as part of a troubleshooting process, be sure to move them back to their original location when done so that gate ID “8” is feeding cavity ID “8” once again.
The fourth tip is perhaps the single most important tip in this article. As it turns out, if we apply a little bit of an understanding of plastic flow to how we mark cavities, then these cavity ID markings can provide us with more than just cavity identification. To make this easier, instead of using traditional cavity IDs, we recommend using “Flow Group” IDs.
Flow Group Science
The science behind Flow Groups starts with fundamental plastic flow principles coupled with the pressure drop equation (more about that below). Plastics flow in a laminar fashion, which means there is no mixing or turbulence created. Therefore the various “layers” of plastic will take certain paths as it flows through the mold. Those paths are typically symmetrical about the mold and can be quite predictable.
A Flow Group by definition is a set of cavities that share identical flow paths/shear history and therefore receive the same material viscosity. A Flow Group must have one cavity in each Region of a mold (a “Region” by definition is an area of the mold that contains only one cavity from each Flow Group). Regions may or may not be a quadrant, depending on the number of cavities and the design of the melt delivery system. Additionally, Regions may not cross one another.
Flow Group IDs consist of a number (Flow Group) and a letter (Region) to identify the cavity and its location in the mold. As an example, the part shown in Figure 3 has the Flow Group ID of “2D,” which means it’s part of Flow Group 2 and is located in Region D of the mold.
Using Flow Group IDs will help you isolate root causes of variations seen in part quality, mold maintenance, and mold balance data. This method allows you to categorize the variations into the “steel” vs. “viscosity” variables from within the pressure drop equation:
If all variables of the pressure drop equation were identical within every cavity of a mold, there would be no variations. But variations always exist to some extent. Therefore we need to separate the variations into potential root causes based on the pressure drop equation’s steel (l and r) variables and viscosity (η).
Since molded parts located in the same Flow Group receive the same viscosity, any variations within a Flow Group can typically be attributed to steel variations. A short list of examples of steel variations include: flow length differences, gate size variations, runner mismatch, venting differences, and wall thickness differences. Additionally, variations between different Flow Groups are attributed to viscosity variations caused by the non-uniform shear history of the different Flow Groups.
An Example
Figure 4 is a 16-cavity example of short-shot data collected and graphed using a conventional cavity ID numbering system (1 through 16). The data shows a calculated mold imbalance of 51%. This data shows a great deal of variation, but you are left to guess at the potential root causes since the variation seems random.
What typically happens at this point can vary by company. Sometimes people will start adjusting the process to try to get all parts in spec. Other times they will pull the mold and tell the tool shop to fix it. But where do they start? Maybe they try opening up runners and gates to try to achieve a better mold balance, but often they end up chasing their tail.
We need to understand that the variations exist for a reason. We simply need to figure out the reasons. This is where Flow Group IDs can be extremely beneficial. Figure 5 shows the same data from Figure 4, but it’s now rearranged according to Flow Group IDs and Regions.
This approach quickly points out a few things. First, there is a significant variation between the four Flow Groups (viscosity variation). Second, there is additional variation within each of the Flow Groups (steel variation).
One helpful hint to keep in mind when evaluating data using Flow Groups is to look for patterns or trends. Using Flow Group IDs in this mold allows us to easily identify a pattern in which the cavities in the A and D Regions of the mold were the heaviest two cavities in every Flow Group. By looking at the Flow Group and Region map, we noticed that Regions A and D were both on the same side of the mold.
We then asked ourselves the question “What would cause one half of the mold to fill before the other half?” After developing a short list of potential root causes, we eventually identified the primary runner as the source of the variations within the Flow Groups. The primary runner feeding Regions A and D measured 0.006” (0.152 mm) larger than the primary runner feeding Regions B and C. This discovery correlates to the pressure drop equation that if the radius (r) is made larger, then the pressure drop is reduced and the plastic takes the path of least resistance.
If the data for this mold was only viewed in the traditional format as shown in Figure 4, we would have very little to go by in order to find the root cause of the variation, because the pattern was hidden by how we were looking at the data. However, by using Flow Groups and Regions, the pattern was easily seen, and a thought process was put together to systematically identify and solve the different root causes.
About the author…

David Hoffman holds degrees in Mechanical Engineering Technology and Plastics Engineering Technology, and he’s worked as a part and mold designer, process engineer, and engineering manager. He’s currently the senior instructor/education development manager for Beaumont Technologies, Inc.’s Plastics Education Courses. Contact him at U.S. 814-899-6390 ext. 131 or dhoffman@ beaumontinc.com.