Cooling Simulation for the Prediction of Quality Properties & Production Costs
…of semi-finished extruded products, like pipes
Previous Article Next Article
By Patrick Weiss, Gregor Hiesgen, Kenny Saul, and Martin Spitz
SHS plus GmbH, Oberhausen, Germany
Cooling Simulation for the Prediction of Quality Properties & Production Costs
…of semi-finished extruded products, like pipes
Previous Article Next Article
By Patrick Weiss, Gregor Hiesgen, Kenny Saul, and Martin Spitz
SHS plus GmbH, Oberhausen, Germany
Cooling Simulation for the Prediction of Quality Properties & Production Costs
…of semi-finished extruded products, like pipes
Previous Article Next Article
By Patrick Weiss, Gregor Hiesgen, Kenny Saul, and Martin Spitz
SHS plus GmbH, Oberhausen, Germany
This paper won the Dow SPE Plastics Pipe and Fittings SIG Best Paper award at ANTEC® 2014.
This paper won the Dow SPE Plastics Pipe and Fittings SIG Best Paper award at ANTEC® 2014.
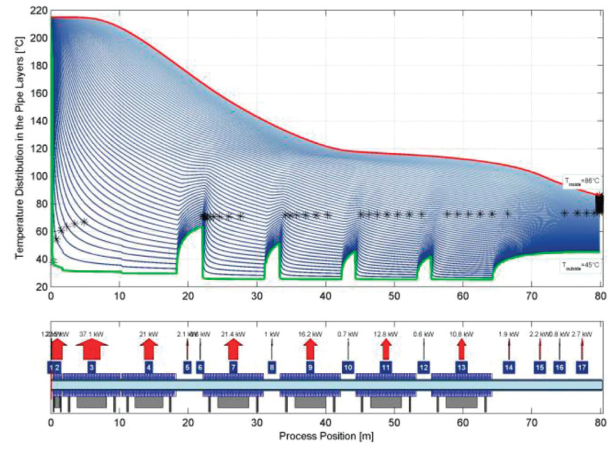
Figure 1: Virtual cooling line and exemplary simulation result
Figure 1: Virtual cooling line and exemplary simulation result
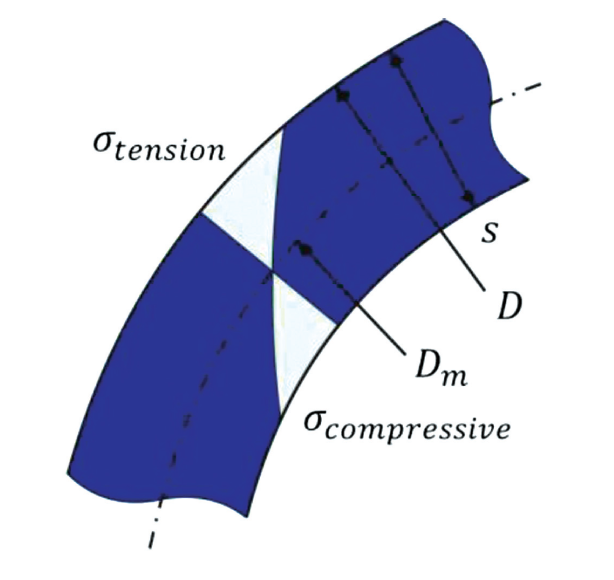
Figure 2: Triangular stress field in externally cooled pipes
Figure 2: Triangular stress field in externally cooled pipes
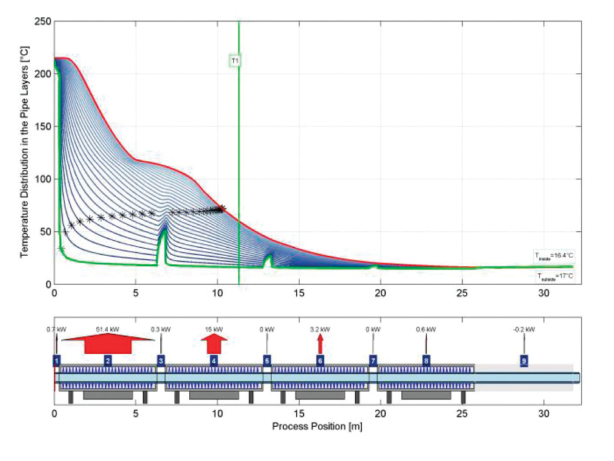
Figure 3: Simulation result for the reference process
Figure 3: Simulation result for the reference process
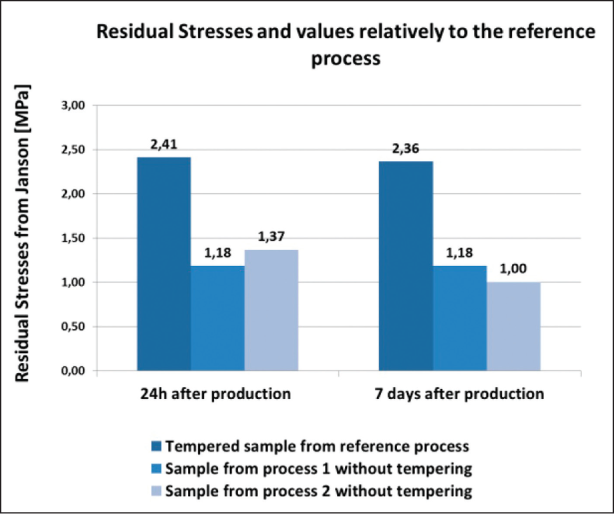
Figure 4: Comparison of residual stresses in different process settings
Figure 4: Comparison of residual stresses in different process settings
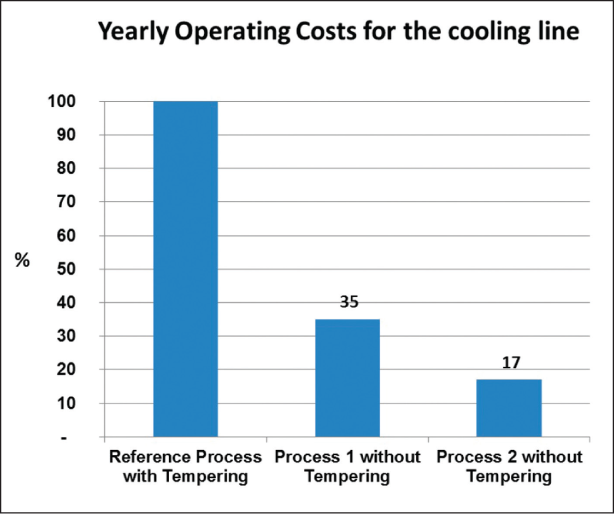
Figure 5: Operating costs for different process settings
Figure 5: Operating costs for different process settings
Manufacturing products with high quality at a competitive price is one of the greatest challenges in pipe extrusion. The quality of a pipe made from thermoplastic polymers is determined by slight deviations from the standard dimensions, the dimensional stability achieved, and the mechanical properties. These attributes depend on various parameters during the cooling process inside the cooling line, and are established and influenced there decisively. At the same time, in addition to the extruder and barrel heating, the cooling process consumes a lot of energy in pumps and chilling machines. For this reason, a detailed consideration of the “cold processing side” of pipe extrusion is doubly worthwhile.
A cooling line in pipe production generally consists of several segments. After the calibration of the pipe, which usually takes place in spray cooling tanks under vacuum, there is a combination of several spray cooling tanks and air cooling stages. This is followed by a caterpillar haul-off and finishing to customer requirements in the form of a printing and cutting section. Within in the cooling line, the most important quality- and cost-determining parameters are the number, length, and configuration of the individual cooling line segments, as well as the temperature settings of the cooling media, like water and environmental air.
In our experience, the cooling lines in most companies were designed and set up on the basis of cooling strategies that have existed for years and which have never been questioned subsequently. Temperature settings that were selected once are often applied universally for the entire range of different products, which can be several hundreds within one company. For an efficiently designed cooling process, the cooling line parameters should take into account the different dimensions being produced and the different materials being used. In most cases the opposite is true, and there is one universal setting for the whole production site. This leads to unnecessarily high process costs and adverse effects on product quality.
Simulation Can Increase Product Quality
Simulation systems allow the simulation of the entire pipe cooling process, from the extruder outlet to custom finishing, without directly intervening in production. The chillWARE cooling simulation software from SHS plus GmbH, Oberhausen, Germany, was developed in cooperation with the University of Duisburg-Essen on the basis of the finite-difference method. It can display the effects of a cooling process change on quality attributes and the costs for providing the process cooling.
Even individual parameters can be optimized for a desired product characteristic or cost savings. This is done by creating a virtual model of all segments of an existing or planned cooling line for extrusion processes. The temperature-dependent thermal properties of the raw material are measured and implemented in a material model database. This consists of the specific heat, the thermal conductivity, the pvT behavior, and important mechanical properties. In this way, it is possible to investigate the effect of numerous parameter changes on product quality and operating costs.1 Simulation modules for simulating the cooling process of other product groups, such as (co-extruded) pipes, sheets, or films, are also available within the simulation program.
For single- or multi-layer pipe, the CoExSIM software module considered here divides the cross-section of the pipe into a finite number of radial layers. The simulation result then shows the temperature distribution over the pipe cross-section and the thermal transitions in the individual cooling line segments, as well as the temperature curves and cooling gradients of the individual pipe layers at any position along the cooling line. Figure 1 shows an exemplary simulation result of the temperature curves for the interior and exterior walls of a pipe.
For every operating point investigated, the required cooling capacity and the resulting cooling costs are determined. In addition, it is also possible to calculate the effects of the cooling process on quality-determining pipe characteristics. This includes the distribution of internal stresses as well as the speed of sound in the individual layers of the pipe. These properties are highly temperature-dependent in thermoplastics.2 The mean speed of sound over the entire wall thickness of the pipe at every position along the cooling stage is extremely important for ultrasonic wall thickness measurement devices.
Residual Stresses Determine Quality
The level of residual stresses is an important quality attribute of extruded pipe. These so-called “frozen-in” internal stresses result from different cooling gradients of the individual pipe layers and a significantly different volume contraction of inner and outer layers. During calibration, the outer layers of the pipe cool down almost immediately. The center layers of the pipe and the interior of the pipe are still quite fluid at this point, which means that initially no stresses can be established here. As these regions subsequently solidify and contract, the resulting shrinkage results in tensile stresses on the inside and compressive stresses on the outside of the pipe when calibrating externally.3 A typical triangular stress field found in an externally cooled pipe can be seen in Figure 2.4
Internal stresses occur both in the axial and tangential directions and are usually undesirable in most applications. Significant stresses can lead to major problems during subsequent processing of plastic pipes, for instance, as the result of so-called “pipe end shrinkage,” after cutting and before welding the pipe ends. Important static physical characteristics of the pipe are reduced as well.5
In the simulation system, the level of residual stresses that results for various operating points can be calculated in advance after the method of Kleindienst.6 The parameters of the virtual process, such as the temperatures of the material and the cooling media or throughput rates, are freely variable. In this way, numerous variations of the process can be compared with one another from a variety of particular standpoints. Furthermore, the effect of additional internal cooling on the cooling process, as well as on the formation of product characteristics, can be calculated.
Comparison & Verification of Theoretical Results in Actual Processes
The results of software-assisted cooling process optimization are presented in the following for one industrial pipe extrusion process. This example involves the production of a wastewater pipe from high-density polyethylene with the dimensions 250 × 9.6 mm (SDR 26), and an assumed output rate of about 350 kg/hr. The cooling line, with an overall length of 40 m, consists of four spray cooling tanks. Each of them has a length of 6 m. The cooling water in all four tanks has a supply temperature of about 15°C. This temperature corresponds to what is commonly used for extrusion of polyolefin pipe.
Because of the high level of internal stress incorporated into the pipe during this industrial cooling process, an additional process step follows before delivering the product to the customer. The extruded pipes are stored in a tempering oven at about 80°C for a specified length of time in order to reduce the stresses in the pipe wall. Figure 3 shows the result of the cooling simulation for the temperature distribution within the pipe, which has been divided into 30 radial layers. (Below, the process presented is designated “the reference process.”) The red line shows the course of the inner wall temperature, and the green line that of the outer wall temperature. The virtual model of the cooling line is shown in the lower area of the figure. The amount of heat removed is shown for each segment. The objective of the investigation is a cooling strategy, through use of which the subsequent and expensive tempering of the pipe can be shortened or eliminated completely.
The so-called Janson Test is an established test for measuring tangential residual stresses.4 For this test, a defined strip is cut out of a sample of the produced pipe in the axial direction, and the amount by which the opening width of the pipe gap reduces is measured after a specified time period. The value of the existing residual stresses is calculated from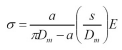
where a is the change in gap width (mm), Dm is the mean pipe diameter (mm), s is the wall thickness (mm), and E is the time- and temperature-dependent creep/relaxation modulus of the pipe material (N/mm2). Considering this parameter, the effect of the polymer-specific relaxation behavior is already included in this measuring method for residual stresses.
Samples taken from the reference process are subjected to the Janson Test after tempering. This test is conducted 24 hours and seven days after the end of production at each time. To optimize the process, suitable operating strategies for the cooling stage based solely on changing the temperature control of the cooling media are established in advance with the help of the simulation results. In this way, it is possible to optimize the process by increasing product quality through reduction of residual stresses and by lowering operating costs. Existing process equipment can still be used, and no limitations with regard to the output rate have to be accepted.
Lower Residual Stresses Combined with Lower Operating Costs
There are two suitable operating points that result from simulation software to decrease the amount of residual stresses, designated as Process 1 and Process 2 below. These operating points are subsequently investigated in actual practice under actual production conditions. For verification, samples of the produced pipes are taken once again and subjected to the same testing program as the samples from the reference process. A comparison of the results is given in Figure 4.
By changing the cooling strategy, the residual stresses are considerably lower than those of the reference process. After 24 hours and after seven days, the pipe from the reference process exhibits residual stresses of 2.41 MPa and 2.36 MPa, respectively. The pipe from the optimized processes exhibits less than half of these values.
The internal stresses are reduced considerably, despite the fact that the entire tempering process is eliminated. Despite the time-dependent relaxation behavior of the thermoplastic, only a very small reduction in the value of the internal stress can be expected after seven days. Additional measurements performed on the samples of the pipes show that it is also possible to reduce the lengthwise shrinkage. The reference sample has a lengthwise change of 0.7% after seven days, while the samples from Processes 1 and 2 show a change in length of only 0.5% and 0.4%, respectively.
The modified cooling strategy also results in reduced operating costs. On the one hand, this result is attributable to the considerable increase in cooling water temperature at some points; and on the other hand [it’s attributable] to deactivating entire segments of the cooling stage, including the recirculation pumps.
While storage in the tempering oven contributes to operating costs, as a result of the associated energy consumption and labor involved, it is possible to eliminate these costs completely by conducting Process 1 or Process 2, both found as a result of the simulation. Figure 5 compares the total costs of the reference process with subsequent tempering with those of Processes 1 and 2, in the form of a percentage. For Process 2, the additional potential associated with use of free cooling is taken into consideration.
Conclusions & Outlook
Through use of computer-aided optimization of the reference process with the chillWARE simulation software, it was possible to improve quality and to reduce costs by modifying the process employed in the cooling line. In an actual production environment, the simulated parameters were applied to reality; the changes made did not result in any problems. The measured results confirm the calculated prognoses both in terms of product quality and in process economics.
The simulation system is currently available in version 1.2 and is being improved continually. At present, new modules are being developed and implemented to simulate the so-called sagging effect and vacuole formation. Development of an automation module will also be completed in the near future.
With cooling line automation, it will be possible to set and monitor the coolant temperatures in the individual segments of a cooling line from a central location. With this software, appropriate parameters are determined for operation of the cooling process and transmitted directly to the system. Quality-relevant product characteristics, such as level of residual stresses, ovalness, sagging effect, or phenomena such as shrinkage, will be improved through automatic adaptation of the cooling line to the simulation results.
The calculation of the residual stresses after Kleindienst leads to qualitatively satisfying results. However, the polymer-specific relaxation behavior is not considered in our material and simulation model yet, whereas the experimental method for the determination of residual stresses after Janson regards this time-dependent relaxation. In our future work we want to implement the consideration of relaxation to get reliable values and predictions for the residual stresses beside the qualitative distribution in the cross section of the pipe.
References
- Hiesgen, G. et al., “Pipe cooling simulation for energy savings and enhanced product quality,” Proceedings of the Polymer Processing Society, 28th Annual Meeting, PPS-28, December 11-15, 2012, Pattaya (Thailand).
- Menges, G., et al., Werkstoffkunde Kunststoffe, Hanser Verlag, München, 2002.
- Carlowitz, B., Die Kunststoffe: Chemie, Physik, Technologie, Hanser Verlag, München, 1990.
- Janson, L.E., Plastic Pipes for Water Supply and Sewage Disposal, 3rd Edition, Borealis, 1999.
- Eyerer, P., et al., Polymer Engineering, Springer-Verlag, Berlin, 2008.
- Kleindienst, U., Untersuchung des Abkühlvorganges und dessen Einfluss auf das Eigenspannungsfeld in der Wand extrudierter Kunststoffrohre, PhD thesis, 1976.