If injection molding means a lot to your business
Pressure loss studies:
Reassessing their real value on today’s shop floor
Previous Article Next Article
By John Beaumont
American Injection Molding Institute, Erie PA, USA
If injection molding means a lot to your business
Pressure loss studies:
Reassessing their real value on today’s shop floor
Previous Article Next Article
By John Beaumont
American Injection Molding Institute, Erie PA, USA
If injection molding means a lot to your business
Pressure loss studies:
Reassessing their real value on today’s shop floor
Previous Article Next Article
By John Beaumont
American Injection Molding Institute, Erie PA, USA

Figure 1.

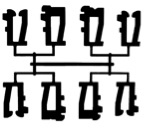
Figure 2a.
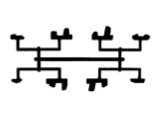
Figure 2b.

Figure 2c.
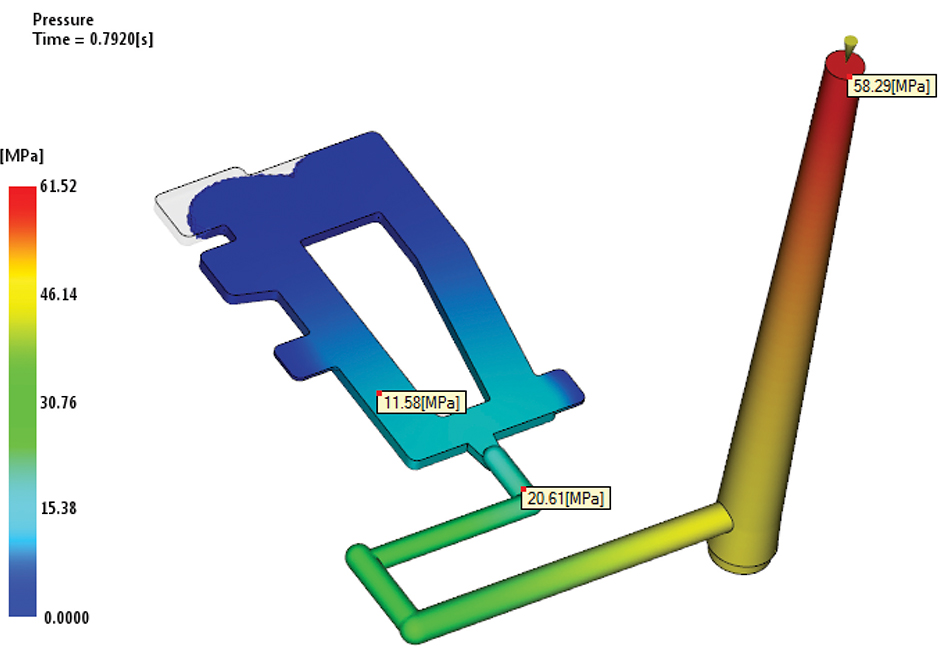
Figure 3.
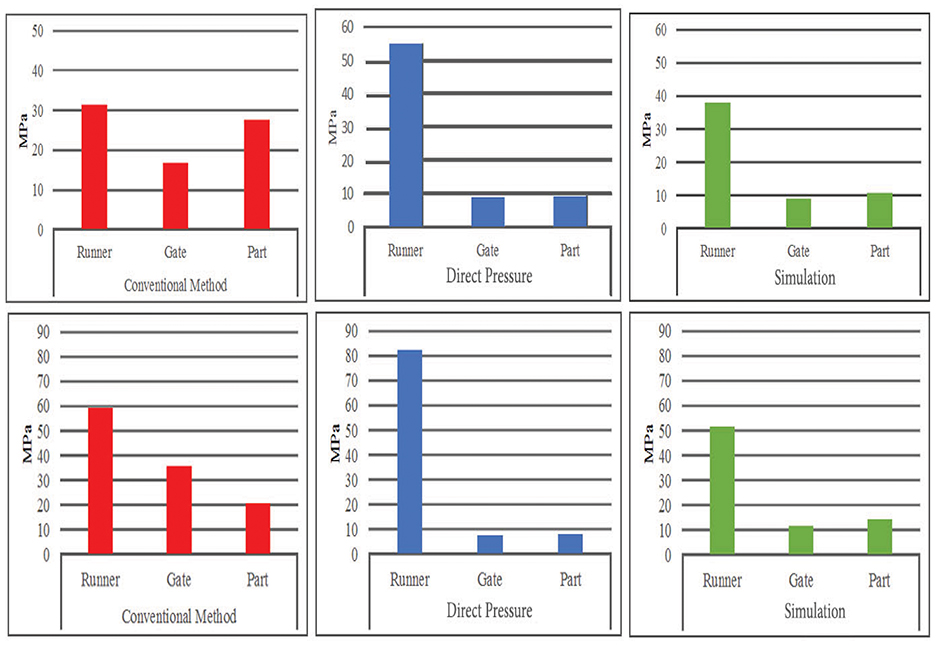
Figure 4.
Figure 4.
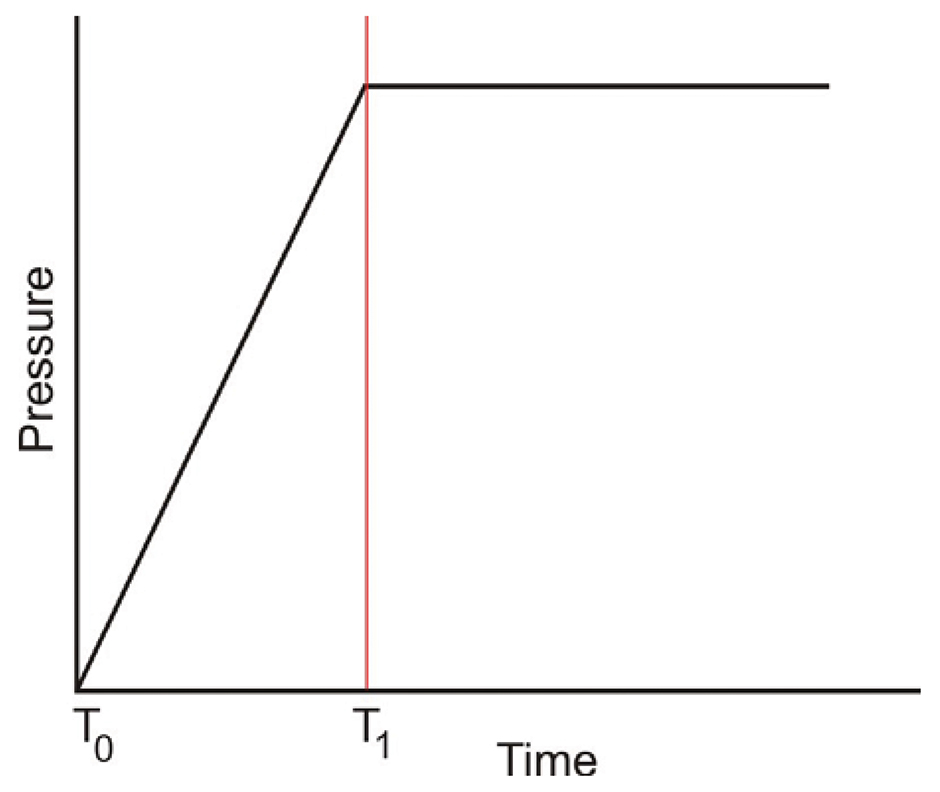
Figure 5.
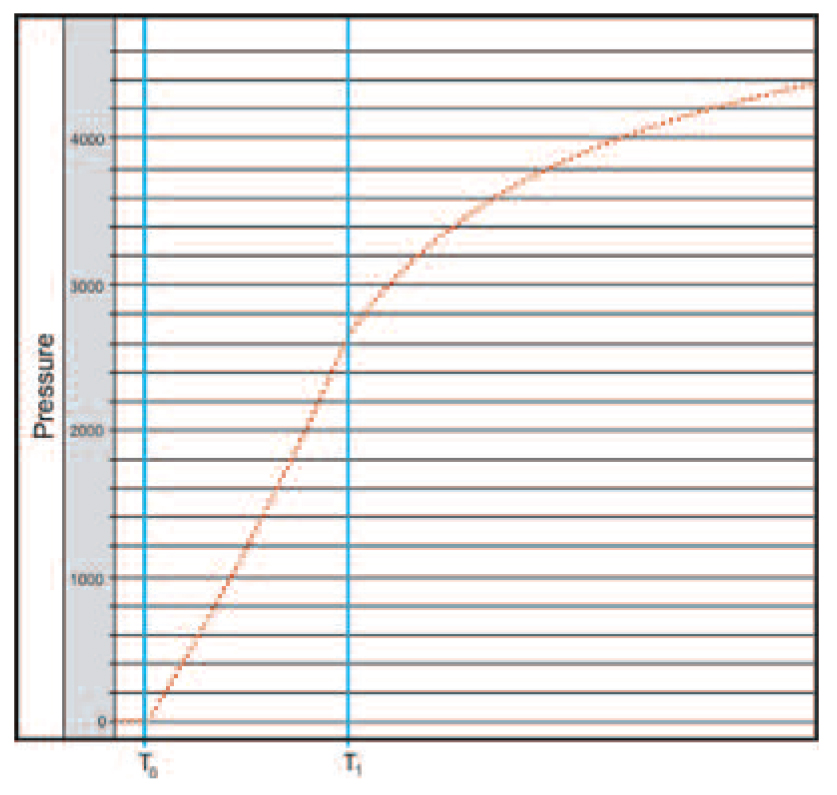
Figure 6.
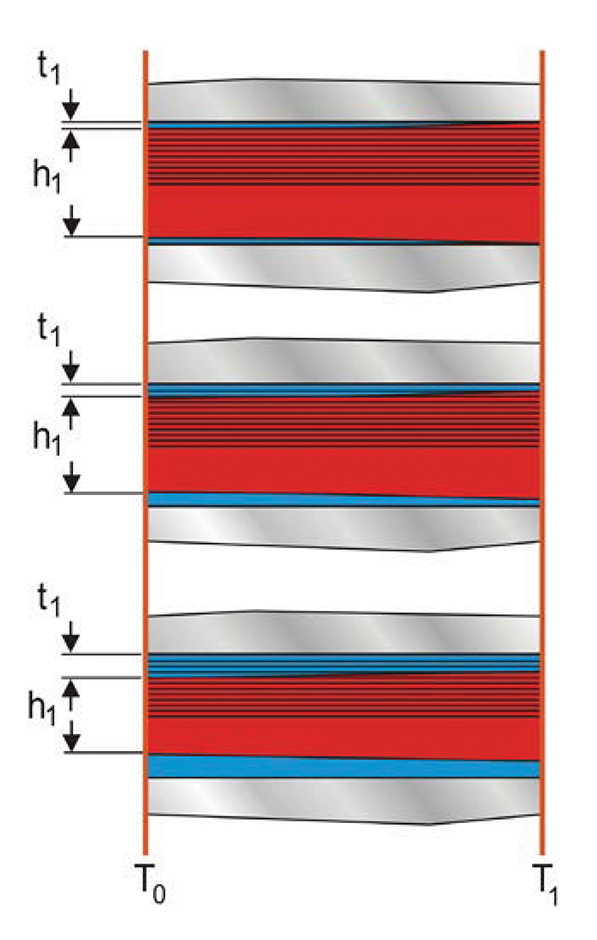
Figure 7.

Figure 8.
Figure 8.

One of our missions at the American Injection Molding (AIM) Institute is to help advance the injection molding industry by questioning its “state-of-the-art” practices and technologies. Although most of these methods and technologies have provided good value, many are nearly two decades old and need to be dusted off and re-evaluated. To many industry professionals, this may seem sacrilege to question these time-honored methods. However, consider the advancements made in the past 15 years in the electronics, software and aerospace industries. Maintaining aging practices in those industries would be considered crazy and practicing them would put a company out of business.
In the plastics injection molding industry, new ideas often move slowly and many professionals are just now seeing 15- to 20-year-old methods for the first time. Case in point – a large number of companies are still using “naturally balanced” runners in their molds, despite extensive research that has proven the advantages of alternative options.
One area of interest is practices surrounding the injection molding process. This first article will build on a presentation given by David Hoffman at the 2016 ANTEC in Indianapolis based on a recent study called “Evaluation of Methodologies Utilized to Determine the Pressure Drop Throughout an Injection Mold,” by Eric Bowersox, Dave Hoffman, and Ben Ellis. The study found that the commonly taught and practiced “Pressure Loss Study” is flawed. Not only, Hoffman said, does the current practice incorrectly diagnose the location and magnitude of the pressure through various regions of a mold, but it also incorrectly represents these pressures when used to evaluate the accuracy of injection molding simulation software. This is particularly interesting as it shows injection molding simulation to be more accurate than what many would have thought to be “real world” data collected on the shop floor. How can simulation be more accurate than the real world??
There have been two purposes for performing the pressure loss study on the shop floor. The first is to quantify the pressure required for the melt to flow through the molding machine’s nozzle and each of the progressive sections of an injection mold. The progressive sections in a mold can include the sprue, the multiple sections of a runner, gate and part-forming cavity. By knowing the pressure drop through these progressive locations, the molder can make judgments as where to modify the mold’s channel sizes if injection pressures are too high. If, for example, mold filling pressures exceed the machine’s pressure limit, and the method determines that 5% of the pressure is in the nozzle, 10% in the sprue, 35% in the runner, 15% in the gate and 35% in the part forming cavity, then it would be most effective to reduce pressures by increasing the diameter of the runner. The second purpose of the pressure loss study has been to evaluate the accuracy of injection molding simulation.
When surveying processors, I found that most conducted this study on nearly every mold, whether it was needed or not – meaning that they were not at, or near, any pressure limited situation. It had simply become a standard practice despite the fact the data was never going to be used.
The methodology for a pressure loss study for an 8-cavity, cold-runner mold can be summarized as follows:
- Determine the target injection rate that you plan on using for production. Use this fill rate for each of the following steps.
- Collect pressure data as follows:
- Determine the shot volume required to fill the cavity to 95% full. Record the pressure required to inject this volume through the machine’s nozzle. For reference we will call this P1.
- Fill the mold to approximately 95% full and record the machine’s peak pressure. (P2)
- Reduce the machine’s shot volume and fill to a position just past (post-gate) the gate (just inside the cavity). Record Pressure (P3)
- Reduce the machine’s shot volume and fill to a position just prior (pre-gate) to entering the gate. Record Pressure (P4)
- Reduce the machine’s shot volume and fill to a position at the exit of the molds sprue. Record Pressure (P5)
- Pressure to fill each of the progressive sections of the mold (sprue, runner, gate and cavity) is then calculated as follows:
- Sprue = P5 – P1 (this actually includes the pressure to move the screw forward)
- Runner = P4 – P5
- Gate = P3 – P4
- Cavity = P2 – P3
Note: The pressure loss study also can be expanded to determine the pressure through each of the progressive branches of the runner (primary, secondary and tertiary).
In the study conducted by Bowersox et al, the conventionally practiced pressure loss study method was contrasted to direct measurements from pressure transducers placed along progressive locations in an 8-cavity mold. The direct measurements isolated pressure in the cavity, the gate and the runner (the runner included both the runner and sprue). Peak pressures at each of the pressure sensors were recorded when the best filling cavity in the mold was 95% full. The study was conducted with both a polypropylene homopolymer and a polycarbonate/ABS material. The study also included the results of mold-filling simulation.
Figure 1 is the parting line view of the 8-cavity test mold with the location of the two in-mold pressure sensors indicated in red.
Figure 2 shows the progressive short shots taken when collecting pressure data for the conventional pressure loss method. (Top to bottom: 95% full, post-gate, pre-gate)
Figure 3 is a mold-filling analysis of the project mold generated by Autodesk® Moldflow® software. Pressure readings at the inlet of the sprue, pre-gate and post-gate, are shown. Note the simulation shows only one of the eight cavities as occurrences were used to represent the additional cavities. (Note: this use of occurrences ignores shear-induced melt imbalances, which are also ignored during most shop-floor pressure loss studies.)
Figure 4 contrasts the pressure to fill the runner, gate and part-forming cavity as determined by the conventional method (left - red graphs), the directly measured pressure data (center - blue graphs) and injection molding simulation (right - green graphs). The top three graphs are from the polypropylene and the bottom three are from the PC/ABS trials. Note that when contrasted to the directly measured pressure data, the conventional method significantly miscalculated the actual pressures and misrepresented the pressure contribution of the three regions (runner, gate and cavity). Also note that although the injection molding simulation underpredicts the filling pressure in the runner, it closely mimics the data gathered via the directly measured pressure data and therefore does a very good job of identifying the relative pressure contribution of the three regions in the mold.
As indicated earlier, the injection molding simulation is actually doing a better job of identifying the pressures and their distribution in a mold than the state-of-the-art shop-floor pressure loss study. This may seem very odd. It is also a bit troubling as the error in the shop-floor methods has often been used to evaluate the accuracy of injection molding simulation.
The problem with the conventional method is that it does not account for the dynamic growth of the frozen layer as the melt continues to flush through early-to-fill regions of a mold. The actual contribution to the total filling pressure of these early-filling regions is more than the pressure required to initially fill them. In this study the conventional method records the pressure required for the melt to flow through just the sprue and runner. What this misses is that as the melt continues to flow to fill the cavity, the frozen layer in the runner and sprue can continue to grow. Small changes in frozen layer thickness can have a significant influence on pressure as it actually decreases the radius of the runner channel. This influence can be seen by evaluating Poisseulle’s equation (Eq. #1), which shows that pressure through a round channel is directly proportional to the radius of the channel to the fourth power.

The conventional pressure loss study assumes that pressure loss through a length of runner would be at its maximum once the melt reaches the end of the runner. This situation is illustrated in Figure 5 where pressure vs. time is illustrated for a length of runner that ends at the edge of a mold. T0 is the time when the melt enters the runner section and T1 when the melt exits the runner and purges to atmosphere. Note that pressure stops rising at the end of the runner as there is no more runner length.
However, in actual molding, the influence of frozen layer growth can be seen using the ThermafloTM MoldometerTM. Here material can be flushed through a runner section to atmosphere as described above. Figure 6 is a pressure curve generated by Thermaflo. T0 and T1 correspond to the time when the melt reaches a first pressure sensor in a runner length (T0) and when it exits the mold and begins purging to atmosphere (T1). Between T0 and T1 we see an expected pressure rise (Y axis) that was illustrated in Figure 5. However, unlike Figure 5, the pressure continues to rise after T1 despite the fact that there is no more flow length. This rise is the result of the continuing growth of the frozen layer. The pressure continues to rise and then begins to level off as the frozen layer becomes thick enough that a thermal balance between heat gain from shear and heat loss to the mold is reached.
Figure 7 illustrates the dynamic conditions along the flow channel, between T0 and T1. The frozen layer illustrated in the top figure would represent the conditions that exist as the melt initially enters the Moldometer measurement channel on the left side and has just reached the end on the right side. The middle and bottom figure illustrate that the frozen layer would continue to grow through this same length as material flushes through it. This creates the continued rise in pressure seen after T1 in Figure 6.
Figure 8 illustrate the same conditions that will occur in the early section of a runner in a mold. Here the melt progressively fills an illustrated runner length. Note how the frozen layer thickness in the early section of the runner (T0 to T1) continues to grow as the runner fills. Ultimately, the pressure to flow through the early section of the runner (T0 to T1) is the pressure required to drive the melt through this section at its most restrictive state – i.e., when the mold is completely filled and the frozen layer is the thickest, i.e., when the runner channel is the smallest.
The study by Bowersox et al acknowledges that this is a limited study. It only includes two materials and one cold-runner mold. However, reinforced by the data provided by Thermaflo, the study certainly raises a red flag and establishes that this heavily practiced method needs some work.
It is my opinion that:
- Data from today’s conventional pressure loss studies can be misleading. In particular, this method will undervalue the actual pressure loss through early portions of a runner system and overvalue the pressure loss through gates and part forming cavities.
- Good value can be gained from this conventional method if you are interested in knowing the pressure loss of the machine and nozzle, or the pressure to fill the mold to 95% full. However, many molding machines will not allow you to take air shots through the nozzle at the same high injection rates commonly used during normal molding. If this is the case, the studies will be flawed.
- The pressure loss study method should not be used to evaluate injection molding simulation except for when the mold is 95% full. Evaluating intermediate pressures in the mold (runner & gate) cannot be accurately done. To contrast simulation pressure predictions to actual fill pressures, one should subtract the pressure loss through the machine nozzle from the pressure loss required to fill the mold to 95%. Again, you need to consider whether the machine will allow you to take air shots through the nozzle at the same high injection rates used during normal molding.
- If you are commissioning a new mold and find that pressures are excessive – you have limited options and I am not confident that a pressure loss study is going to help you. If pressure is excessive:
- Logically, you would consider a lower pressure drop machine nozzle; a larger diameter sprue (possibly a hot sprue) or increase strategic diameters of the runner system. Most likely you are not going to thicken the walls of the part; you should not open the gates, as they should be designed for a purpose (and most likely you will not gain much from this).
- You could consider a properly designed graduated runner to reduce pressure through the runner. However, be conscious of the negative aspects of graduated runners (to be covered in future issues of this series).
- Based on this study, injection molding simulation provides a good quality means to strategically adjust sizes of an undersized runner. Even if the simulation incorrectly calculates the total pressure through the mold, the relative pressure loss through the various regions should be more accurate than the data provided by the conventional pressure loss study method.
If you choose to continue to perform the conventional pressure loss study, recognize that it could lead you to make changes to the wrong portions of the runner and gates to correct pressure limit issues.
You should also ask yourself if you are doing the study out of curiosity or because you are close to, or at, a pressure limited process?
- If out of curiosity, then you have to ask yourself, “What am I going to do with the data?” If nothing, then why do it at all, other than to check off a box during validation and make a nice graph? Time is money and you are wasting both.
- If you are doing it to try to get out of a pressure limited situation, you have to ask yourself what can you realistically change?
- Can you change the part? 99% of the time you can’t.
- Should you modify the gate design? Gates are usually not the largest pressure source unless they are extremely long and restrictive (in this case you have a poor design to start with and probably have numerous additional issues). Changing gate size within reasonable limits usually isn’t going to decrease the pressure enough to get out of a pressure limited situation and into a wide processing window.
- Therefore, realistically, the most logical means to reduce the fill pressure is to modify the runner. In most cases, someone doesn’t need a shop-floor study to tell them that. If simulation was performed, you should simply go back to simulation and change the design to lower the pressure in the most effective manner possible. Again, you don’t need to spend more time on the shop floor to tell what you should already have known.
Progress comes from change! Change begins with questioning everything!
If you feel you are on the right track, you might want to consider where the track is taking you.
About the Author
 John Beaumont, is President of both the American Injection Molding Institute ( www.aim.institute) and Beaumont Technologies located in Erie PA. The primary mission of the AIM Institute is to help advance the injection molding industry by providing high level educational programs to practicing professionals. Contact: jbeaumont@aim.institute.