Plastics Filling Simulation Software: A 30-Year Journey
This "user's perspective" reveals winning strategies for using simulation today
Previous Article Next Article
By Mark Rosen
Corex Design Group, Franklin Lakes, New Jersey, USA
Plastics Filling Simulation Software: A 30-Year Journey
This "user's perspective" reveals winning strategies for using simulation today
Previous Article Next Article
By Mark Rosen
Corex Design Group, Franklin Lakes, New Jersey, USA
Plastics Filling Simulation Software: A 30-Year Journey
This "user's perspective" reveals winning strategies for using simulation today
Previous Article Next Article
By Mark Rosen
Corex Design Group, Franklin Lakes, New Jersey, USA
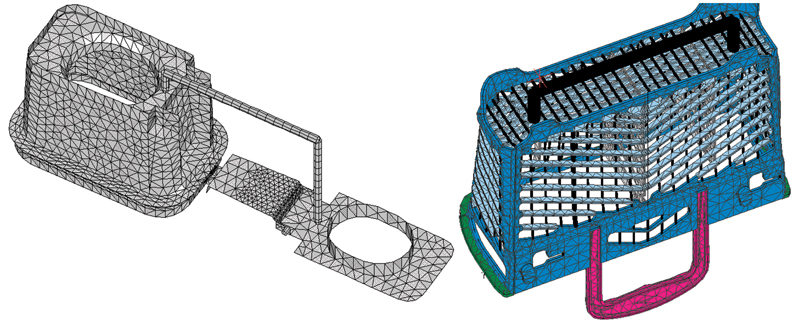
Figure 1: A 2½-D mesh from the early 1980s. Note the low number of elements and crude representation of the part and runner. On the right, a dishwasher basket is shown with elements “puffed” to show thickness.
Figure 1: A 2½-D mesh from the early 1980s. Note the low number of elements and crude representation of the part and runner. On the right, a dishwasher basket is shown with elements “puffed” to show thickness.
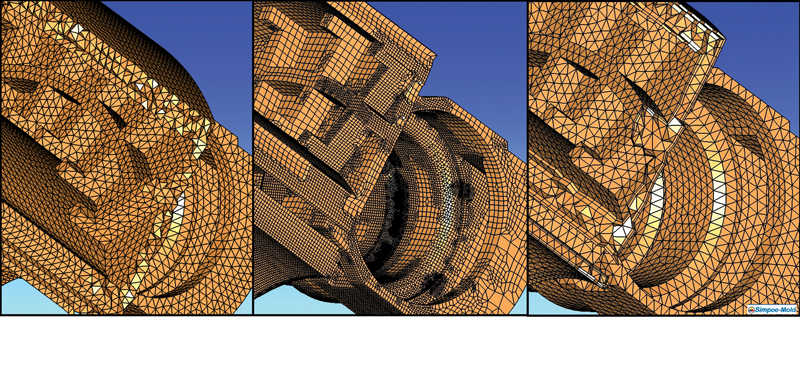
Figure 2: Today, analysis is typically done with 3-D meshes of various types shown above: tetrahedral (left), hybrid tetrahedral/ hexagonal, and hexagonal (images from Simpoe meshes). Deciding which mesh to use depends on the skills of the analyst for a balance of analysis time vs. accuracy of results.
Figure 2: Today, analysis is typically done with 3-D meshes of various types shown above: tetrahedral (left), hybrid tetrahedral/ hexagonal, and hexagonal (images from Simpoe meshes). Deciding which mesh to use depends on the skills of the analyst for a balance of analysis time vs. accuracy of results.
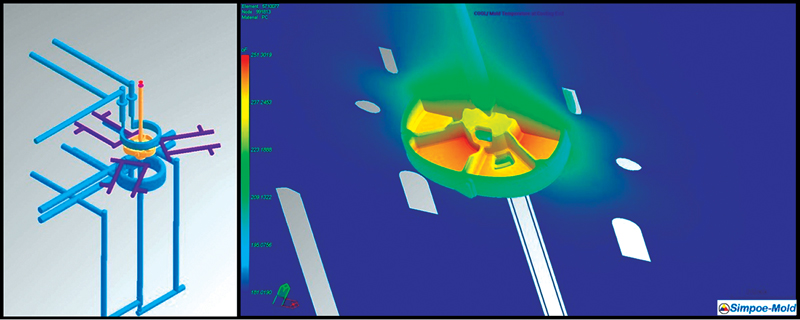
Figure 3: Analysis model of a two-shot overmolded cap with a complicated mold cooling layout. On the right image, the mold temperature at the end of cooling is shown for the part cavity and cross section of the mold.
Figure 3: Analysis model of a two-shot overmolded cap with a complicated mold cooling layout. On the right image, the mold temperature at the end of cooling is shown for the part cavity and cross section of the mold.
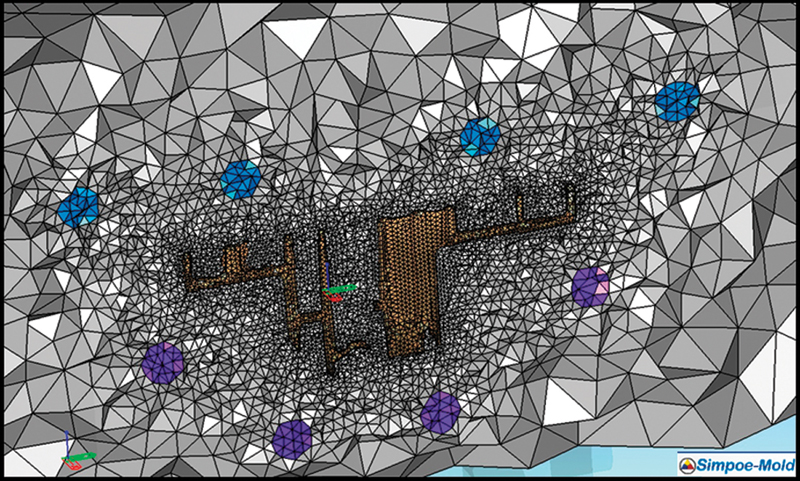
Figure 4: Cross section of a 3-D mesh of a part, mold, and water lines. This mesh has more than 3 million elements, resulting in longer analysis times.
Figure 4: Cross section of a 3-D mesh of a part, mold, and water lines. This mesh has more than 3 million elements, resulting in longer analysis times.
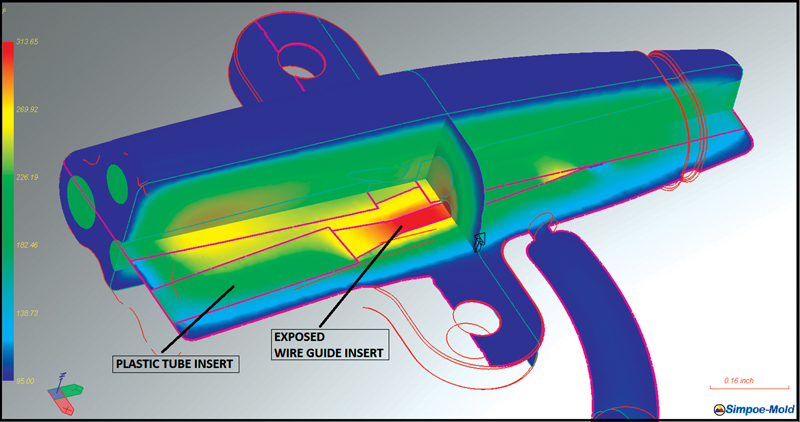
Figure 5: Temperature at time of mold opening for a medical part overmold with a plastic tube and insert wire. The software calculates the thermal effects of the inserts: the tube (an insulator) and the wire (a conductor). This allows for the analysis of potential sink/voids due to the heating of the exposed wire insert.
Figure 5: Temperature at time of mold opening for a medical part overmold with a plastic tube and insert wire. The software calculates the thermal effects of the inserts: the tube (an insulator) and the wire (a conductor). This allows for the analysis of potential sink/voids due to the heating of the exposed wire insert.
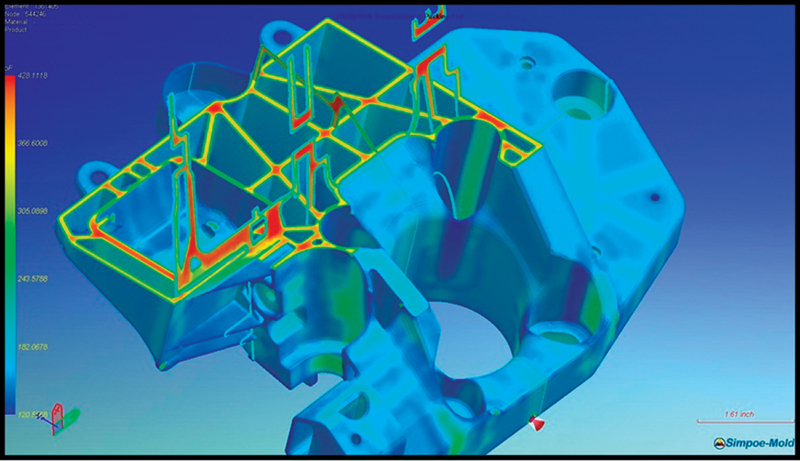
Figure 6: Analysis image of an automotive bracket, showing part temperatures and cross section at end of an 18-second pack time. Note the higher temperatures at thicker wall sections.
Figure 6: Analysis image of an automotive bracket, showing part temperatures and cross section at end of an 18-second pack time. Note the higher temperatures at thicker wall sections.
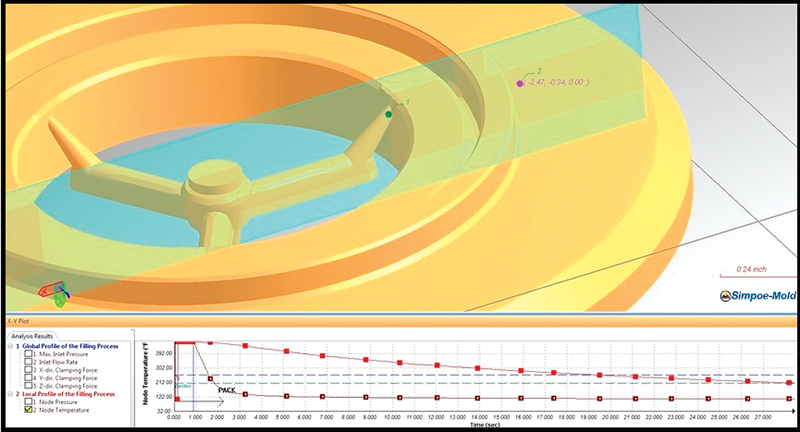
Figure 7: Graph of time vs. temperature at the gate and thicker section of a part. Note that gate sets up at 1.7 seconds, while the thicker section of the part requires 19 seconds. The graph shows that the use of higher pack pressures or a larger gate is required to adequately pack out the thicker section of this part.
Figure 7: Graph of time vs. temperature at the gate and thicker section of a part. Note that gate sets up at 1.7 seconds, while the thicker section of the part requires 19 seconds. The graph shows that the use of higher pack pressures or a larger gate is required to adequately pack out the thicker section of this part.

[Note: The author can be reached at mrosen@corexdg.com or U.S. +1 201-970-9188; learn more about the author’s services at the end of the article.]
Back in the 1980s, as a graduate student studying plastics engineering at (what was then called) the University of Lowell, I remember sitting in the new computer lab staring at several unopened boxes of mold filling analysis software. The software was shipped on 8-inch floppy disks and only ran on a mainframe computer with dedicated work stations.
As an eager young graduate student, I had soaked up the many articles written in the trade magazines and conferences on filling analysis. Even back then, the advertisements made it seem like the software was powerful and easy to use—such that even an inexperienced designer could use it to design better plastic parts. As I dove into learning this software, I soon found out that these claims were a bit of a “stretch of the truth.” However, with hard work, patience, and practical engineering common sense, I found I could use the software as an effective tool to help design and troubleshoot injection-molded plastic parts.
As computers evolved, so did this technology, with more powerful and easier-to-use programs becoming available. Many of the earlier analysis software companies are now gone, and others have been purchased by larger software companies. Over almost 30 years, I learned and ran many of these different analysis programs for well over a thousand plastics projects, using various filling analysis software programs as engineering tools to assist in the product design and troubleshooting of plastics, rubber, and rigid thermoset parts of almost every conceivable application (from microfluidic lab chips to plastic deer antlers!).
But the topic of filling analysis, even today, is still a bit of a mystery to many plastics engineers and managers. So it might be useful to present a brief history of filling analysis software, along with outlining some of the features of today’s programs and recommending some winning strategies for the use of this software. (One note: The images and examples contained in this article are from projects I worked on using Simpoe software, by Dassault Systems, the analysis software I currently use for analysis work.)
The Early Years...
In the early days of filling analysis, there was only one filling analysis software company, Moldflow Ltd., and you had only two choices of analysis: You could run a 2½-D mid-plane mesh analysis or a “strip” analysis. For the first option, you needed to manually build a mesh to represent the part. You would make a mesh representing a part by using points and lines to build individual surfaces. These surfaces would then be assigned thickness. Runners would be modeled as line elements which would then be assigned diameters.
The second option was to make a model called a strip analysis. This was a process where you modeled flat strips going from the gate to the last region of the part to fill. These surfaces were assigned a thickness by the user and meshed with three-node triangular elements. Computing power and storage was severely limited, so, when building a mesh, you could only use a limited number of elements (a few thousand), which resulted in crude representations of the part (Figure 1, for example).
This process of building the mesh took a lot of skill, patience, and “creative visualization.” Once this was done, you selected a material from a database, set your process settings, and let the computer run for many hours of analysis time. The software would calculate items like fill pressure, shear rates, shear stresses, and temperature drop.
With the strip analysis, you also got the added output of a process window. This mid-plane mesh analysis analyzed the thickness of each element into as many as 12 layers (or more) and calculated the properties through the thickness of each element using a “marching” finite element analysis. It was some pretty complicated math. If used correctly, this software helped with tasks like improving the part filling balance and runner sizing.
Also, back then, filling analysis software only looked at the filling stage of the injection molding process. By today’s standards it was primitive stuff, but if used correctly, it did help you design better plastics parts.
Where Flow Simulation Software is Today...
As computers got more powerful, additional features were added to the programs. First there was packing analysis, which required additional material data, including pressure-specific volume-time relationships to calculate volumetric shrinkage. Later still, features such as warpage and cooling analysis utilizing the mold cooling circuits were added. In time many other features were added to analyze different plastics processing technologies such as RIM, thermoset molding, sequential valve gating, gas-assist molding, structural foam molding, multi-shot molding, and insert molding, just to name a few.
In the late ‘90s, as computers got even more powerful and memory capacity increased, the meshing capabilities of the software improved. First, there was “dual-domain” meshing. This was the start of the attempt to eliminate the long hours required to manually build a mid-plane mesh. This meshing technology still used three-node triangular elements; however, the program would “auto”-mesh the inner and outer surfaces of the part to produce a single mid-plane mesh with calculated wall thickness. In the results, the part appeared to be 3-D; however, the analysis was still using the old 2½-D flat elements. It all sounded good, but it was hit or miss with the ability to build the mesh and with the accuracy of flow front and warpage. Mostly, it worked better for simpler-geometry parts with uniform wall thickness.
More recently, true 3-D meshing has become more of the standard in filling analysis. The benefits of the 3-D meshing are improvements in the ability to accurately mesh the part for improved analysis results. However, the trade-off is that the size of the analysis model has exponentially increased. With solid elements, you have as many as eight nodes per element (vs. three nodes for the triangular mesh), and you need at least five elements through the thickness of the part to get good results. This results in models of well over five-million elements and requirements of over one gigabyte of storage for a single iteration. Even with today’s fast computers, these large analysis projects still can take from several hours to as long as a one-day run.
Quick Summary of Software Features & Capabilities
With today’s filling analysis programs, the steps for running an analysis have not changed. You need to first build a mesh, select your resin, set your injection location, set process settings, and then finally select the type of analysis to run. However, today there are many more options and features than in the past.
The first step is to generate a mesh of the part. The type and quality of the mesh will affect the accuracy of the results along with the time required for analysis. There are many options today for meshing parts, including the older-style dual-domain surface mesh, 3-D tetrahedral mesh, 3-D hexagonal mesh, and hybrid 3-D tetrahedral and hexagonal (see Figure 2).
It’s also possible model other components in the mold besides the part and runner. Some of these items include (also see Figures 3, 4, and 5, for examples):
- cooling circuits, including bubblers, baffles, and conductive inserts;
- modeling of hot runners along with air gaps;
- modeling of mold components, including inserts; and
- overmold inserts, overmolded components, in-mold labels, and multi-shot molding.
Perhaps the most important item for accurate analysis is the material data. This data is typically included in the material database of the analysis program. Filling analysis material data is far more expansive than a typical data sheet. It includes many items such as thermal data, viscosity/shear-rate curves, and pressure-specific volume-temperature curves. This data is converted into constants which are specific for the different analysis programs available today.
However, finding your exact grade of material in the database is not always possible. This is because of the huge number of plastics grades available today and the fact that many have not been characterized for filling analysis. Also, older trade-names may have changed due to changes in the ownership of material companies. If data is not available, one option is to have a lab generate it. Another option is to use a comparable material from the database which has similar molding properties.
For the process settings, with more advanced analysis programs available today, there are many options for solvers to simulate the processing of different types of materials and various processing technologies. Understanding how to use these options correctly requires training and experience with the software, together with real-world injection molding expertise.
Getting Results
The final step of an analysis is viewing the results. There can be a huge amount of data produced for each analysis iteration. It’s not uncommon for a single analysis iteration to contain more than a gigabyte of data. These results are typically presented as separate stages of the cycle (for example, see Figures 6 and 7); results can include:
- full 3-D visualization of results for Fill, Pack, Cool, and Warp stages;
- animations of results;
- thickness data, via cross sections of part:
- graphs of data; and
- auto report and “smart” analysis recommendations.
With all this information available to the analyst, it’s important to remember that the goal of analysis is not to produce pretty pictures but to identify potential problems and to make recommended changes.
Each analysis project has its own unique set of issues and requirements. Typically, I turn off auto report and smart analysis recommendations, since they often are too general in nature to address the specific need of the analysis.
The requirements for a good analyst have not changed in the 30 years since the start of the technology. It’s still essential that the analyst have a broad understanding of the use of the software, along with expertise in the processing behavior of the different plastic materials, product design, and tooling. Even with these skills, analysis takes time, often with the need to run many iterations to test theories before final recommendations can be made.
Winning Strategies for Using Filling Analysis
1.Use analysis at all steps of the design process. Do not depend on the toolmaker to run the analysis as a “quick check” before building the mold.
2.Use analysis as a screening tool early in the design process. Some objectives of this screening analysis are:
- setting nominal wall thickness of the part based on fill pressure;
- screening materials for fill pressure;
- helping design the part for moldability; and
- identifying parts which require more detailed analysis.
Get input from as many outside team members as possible to provide unbiased and fresh design input. Do not rely on a single internal source for analysis and design review.
3.Good analysis takes time. Note that free analysis offered by material companies may be fine for simpler projects but may miss key issues for more complicated projects.
4.For more complicated projects, if in-house expertise is not available, locate an experienced outside analysis and design consultant for help.
- Use an analyst who is recommended from colleges or companies you respect.
- Make sure the analyst has experience with your type of product and material.
- Make sure the analyst also has expertise in materials, part and tool design, and processing.
- Ensure that the analysis is not run by a less-experienced team member of the company.
- Make sure the analyst will dedicate the time and effort to run the required number of iterations to find the optimal solution.
5.Use outside experts to help educate part and tool designers to better understand the relationships with plastics materials and tool and part design rules, as well as processing.
6.For large multicavity tools, note that the use of filling analysis does not replace the need for prototype tooling. No simulation result can be trusted as 100% accurate.
In summary, since filling analysis software’s start around 30 years ago, much has advanced with the technology and capabilities. However, the same claims made back then still are true today. In the right hands, this technology can help companies produce better molded parts and save money in tooling and processing costs. However, it’s still only an engineering tool which requires a broad knowledge of plastics materials, design, and processing expertise to make best use of.
About the author…

Mark Rosen is founder of Corex Design Group (www.corexdg.com), an award-winning plastics consulting firm consisting of plastics industry veterans available to assist companies with design, engineering, analysis, and technical marketing. The company was founded in 1992 and is located in northern New Jersey, USA. He can be reached via e-mail at mrosen@corexdg.com or by phone at +1 201-970-9188.