Weather Bike
A Bicycle-Based Weather Station for Observing Local Temperature Variations
by John J. Cassano
AFFILIATION: Cassano—Cooperative Institute for Research in Environmental Sciences, Department of Atmospheric and Oceanic Sciences, University of Colorado, Boulder, Colorado
CORRESPONDING AUTHOR: John J. Cassano, 216 UCB, CIRES Building Room 318, University of Colorado, Boulder, CO 80309
E-mail: john.cassano@colorado.edu
DOI: 10.1175/BAMS-D-13-00044.1
©2014 American Meteorological Society


Anyone who has walked or bicycled from an open field into a forest on a warm, sunny day or into a shallow topographic depression in the early morning or evening has likely noticed an appreciable change in near-surface air temperature (hereafter referred to as temperature) across these land use and topographic types. (See the “For Further Reading” section for additional articles related to human biometeorology and the factors that influence how humans perceive changes in temperature.) These temperature changes occur on a small scale easily observed by a person moving under their own power. A handheld portable weather station (Kestrel 4000) capable of recording observations as frequently as every 2 s was mounted on a bicycle (Fig. 1) to observe local temperature variations in the vicinity of Boulder, Colorado, during the winter of 2013. The results presented here show examples of local temperature variability, with some changes in temperature in excess of 10°C over distances of the order of 1 km.
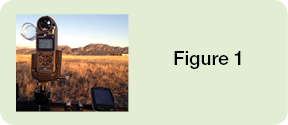
THE WEATHER BIKE. The Kestrel 4000 handheld weather station, manufactured by Nielsen-Kellerman, is an ideal choice for making bicycle-based weather observations due to the rapid response time of the temperature and pressure sensors (reported as 1 s), which allow for observations of small-scale (< 1 km length scale) features in the surface temperature field, the ability to easily log data at a user-chosen interval of 2 s to 12 h, the ability to easily transfer this data to a computer for analysis and plotting using Bluetooth wireless transfer, the small size (12.7 × 4.5 × 2.8 cm and 102 g), and the relatively low cost (~$350). The Kestrel 4000 was mounted on a Kestrel tripod clamp that was attached to the bicycle handlebar using a USA Gear bicycle handlebar camera mount. A Garmin Edge 800 GPS was also mounted on the bicycle to log position information during each ride. The time on the Kestrel 4000 was set to match the time on the GPS unit, allowing the Kestrel data to be easily georeferenced. The Kestrel observations were imported into Excel and plotted as a function of time.
The decision to mount the Kestrel 4000 on a bicycle rather than making handheld measurements was based on the fact that the bicycle-mounted instrument would be well ventilated due to typical bicycling speeds of 5–10 m s-1. This helped reduced any radiation-induced errors in the temperature measurements and ensured rapid adjustments to local temperature changes. In addition, by mounting the instrument on a bicycle, observations over distances of 20 km could be made within 1 h, allowing for sampling of many topographic and land-use changes in a relatively short amount of time. Several previous research projects (see “For Further Reading”) have used bicycles to observe urban heat island and land use effects on air temperature. The American Meteorological Society formed the Committee on Mobile Observations in 2009, which in part considered the use of automobiles to observe mesoscale temperature variability. The Weather Bike concept described here builds upon these previous efforts and demonstrates the ability of bicycle-based meteorological instrumentation to observe topographic variations in near-surface temperature, and the potential use of these bicycle-based observations for atmospheric science education.
To illustrate the local temperature variability that can be observed with a bicycle-mounted weather station, three examples from January 2013 are shown below. For these examples, only data from the Kestrel weather station (temperature, pressure, and time) are shown, with GPS data used to provide a spatial context for the weather observations.
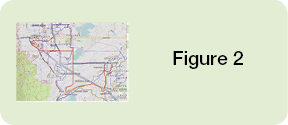
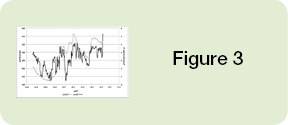
LOCAL TEMPERATURE VARIABILITY OBSERVED WITH THE WEATHER BIKE. Observations from 0725 to 0820 LST on the morning of 18 January 2013 (Figs. 2 and 3) show a close correspondence between temperature and elevation (pressure), with the temperature in the depressions in the local topography that is in excess of 5°C colder than over the adjacent higher terrain.
The route of this bike ride (Fig. 2, red line) starts on a broad flat-topped mesa (Davidson Mesa) in Louisville, Colorado, initially going south and then west, through a residential neighborhood, for 1.6 km. The route then turns south and descends the south side of Davidson Mesa, dropping 48 m, into a light commercial district. After crossing a major highway (US 36) the route turns northwest and parallels the highway, climbing 50 m back to the top of Davidson Mesa. The route then turns west-southwest and again drops off of Davidson Mesa following a narrow valley (700 m wide and up to 65 m below the adjacent ridges) between Davidson and Marshall Mesas. This portion of the route passes through open grassland. The route crosses Davidson Mesa one last time as it turns north near the town of Marshall. Upon descending from Davidson Mesa, the route enters the South Boulder Creek valley, where the land cover is primarily open grassland with a few houses. After passing a reservoir, the route turns west and climbs toward the foothills, passing through residential and light commercial areas of Boulder.
The temperature observations from this ride (Fig. 3) illustrate several aspects of local temperature variability that can be readily observed with a bicycle-based weather station. Over the first 20 s of the ride (data are logged at 10-s intervals), the temperature drops from 6.5° to 1.3°C as the Kestrel 4000 adjusts from the indoor temperature (where it was stored overnight) to the ambient outdoor temperature. This rapid adjustment occurs when the Kestrel becomes well ventilated once the bicycle begins moving. The temperature on Davidson Mesa (0725 to 0733 LST) varies from 3.7° to 0.6°C over very short times and distances. Upon descending from Davidson Mesa (0733 LST), the temperature decreases 5°C, from 3.6° to -1.4°C, indicative of cold-air pooling in the local topographic depression at the base of the mesa. The temperature is then observed to climb irregularly to over 4°C, with variations of up to 4°C over time periods of 30 s, upon ascending to the mesa top near US 36. Between 0748 and 0754 LST, over a distance of 3 km, the temperature drops from 3.7° to -5.0°C as a strong cold pool of air is penetrated in the narrow valley between Davidson and Marshall Mesas. The temperature then rises to 3.6°C (at 0758 LST) as Davidson Mesa is crossed one final time, with small-scale fluctuations of up to nearly 2°C evident across the top of the mesa. The temperature falls to a ride minimum of -5.1°C at the lowest elevation of the ride in the South Boulder Creek valley. Temperature in the valley (0758 to 0815 LST) varies by up to 5°C over periods of 2.5 min. The temperature then steadily increases as the route climbs to higher elevations near the foothills and into the built environment of Boulder. Given the timing of these observations shortly after sunrise, the observed temperature also includes a contribution from the diurnal temperature cycle. Comparison of the Weather Bike–observed temperature with that observed by several local weather stations (http://foehn.colorado.edu/weather) indicates that the observed changes in temperature during the bicycle ride reflect local temperature variations with only a small signal from the gradual warming occurring after sunrise (not shown).
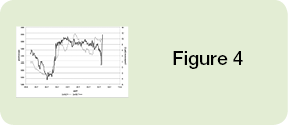
A different character of local temperature variations was observed on the bicycle ride between 0709 and 0759 LST on 22 January 2013 (Fig. 4), although the route of this ride was identical to that on the morning of 18 January (Fig. 2). On this morning the temperature varied between -4.4° and 10.7°C, but showed much less variability on time scales of a few minutes than on the morning of 18 January (Figs. 3 and 4). The main feature of the morning’s temperature observations was a large drop in temperature from 8.8° to -4.4°C between the top of Davidson Mesa (0739 LST) and the South Boulder Creek Valley (0748 LST) over a distance of 3.2 km. The temperature then climbed to 6.1°C upon entering Boulder. One notable small cold pool was observed at the start of the ride on top of Davidson Mesa (0710 LST), where the local minima in temperature was 0.8°C compared to the ambient temperature on the mesa top of near 8°C. This cold pool was located in a very small valley (200 m across), with a local relief along the bike route of just 10 m. The initial warm temperature of 11.4°C at the start of the ride (0709 LST) reflects the indoor temperature where the Kestrel was stored overnight, but this nonrepresentative temperature quickly adjusted to the ambient outdoor environment upon the start of the bike ride and adequate ventilation of the Kestrel.
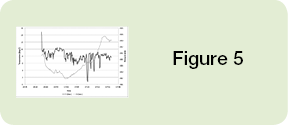
An evening bicycle ride from 1645 to 1733 LST on 25 January 2013 (Figs. 2 and 5) displays how quickly small-scale local temperature variability develops near sunset. On this night, sunset occurred at 1712 LST. For this ride, the route left the University of Colorado campus following the wooded Boulder Creek path east. The route then turned north parallel to Foothills Parkway—a major highway—before turning east on Valmont Road, passing through a light commercial area. The ride then turned south, passing through mainly open grassland and some small residential areas before turning east on South Boulder Road. The temperature observations along South Boulder Road from 1716 to 1727 LST, covering a distance of 4 km (Fig. 5), are of particular interest. Along this portion of the bike ride the temperature was observed to vary by up to 8°C on time scales of 40 to 100 s and spatial scales of 300 m to 1 km. These temperature variations were not associated with land use changes, as this portion of the ride traverses mainly agricultural land. The temperature changes appear to be tied to small-scale topographic features (as shown by the pressure changes in Fig. 5), with elevation relief of just a few meters. The fact that such large temperature variability is associated with such small topographic features, and that these temperature changes are established only minutes after sunset, was a surprise to the author.
THE WEATHER BIKE AS AN EDUCATIONAL TOOL. One of the exciting aspects of teaching atmospheric science is that the students often have firsthand experience with the phenomena being discussed in their classes. The challenge that atmospheric science educators face is to tie the students’ personal experience with the weather into the topics being discussed in class in a way that captures the students’ attention. The relatively low cost and fun Weather Bike provides an opportunity for students to make their own observations of local temperature variability, providing a way to actively engage the students in the discussion of topics related to controls on local temperature. These observations could serve as the basis for classroom discussions about microclimate, including the role of land use and topographic factors in controlling local temperature, issues related to the local surface energy budget and near-surface temperature, and factors that impact local microclimate variability such as time of day, cloud cover, and wind. The Weather Bike observations could also be used to discuss instrumentation issues such as instrument response time, how this varies with ventilation, and the impact of radiative heating when no ventilation is applied. The issue of temporal versus spatial variability in observations from a moving platform could also be discussed by highlighting the impact of the diurnal temperature cycle on the Weather Bike observations.
The data collected by the Weather Bike could also be used by students to perform basic meteorological calculations. Students could use these data to make pseudosoundings and compare these “soundings” with local National Weather Service radiosonde observations. Classroom discussions or assignments could then focus on why these two types of soundings produce similar or dissimilar results. The data from the Weather Bike could also be used to calculate potential temperature and estimate static stability from the Weather Bike pseudosoundings. Analysis of the potential temperature along the terrain traversed during the bike ride could be used to discuss the dynamics and thermodynamics of topographic slope flows. Students could use the observed temperature and pressure and a known starting elevation to calculate the elevation along the bike route using the hypsometric equation. This calculation could then be repeated using standard atmosphere temperature values. The difference in elevation between these two calculations would illustrate the impact of the assumed temperature on hypsometric calculations.
One engaging way to incorporate these concepts into a course would be to ask students to state hypotheses about where, when, and under what meteorological conditions the largest local temperature variability would be observed, or to state hypotheses regarding observational issues related to instrument response time, ventilation, and radiative heating. Teams of students could then make measurements with the Weather Bike to test their hypotheses. A discussion of what additional observations and observational strategies would be needed to more thoroughly test the student hypotheses could highlight the types of considerations that go into planning observational field campaigns.
SUMMARY. This short note has shown how a simple and inexpensive bicycle-mounted portable weather station, dubbed the Weather Bike, can be used to make observations of local temperature variability. The magnitude of temperature changes observed near Boulder, Colorado, during January 2013 were surprising to the author, especially given the very short spatial scales over which this variability was observed. These types of data could be used to excite students about microclimate and instrumentation issues being discussed in their classes, and teams of students could be given Kestrel weather stations so they could make their own observations to test hypotheses related to concepts discussed in their classes. It is likely that the primary educational benefit of the Weather Bike would be to provide a link between the students’ own nonquantified experiences with local temperature variability and direct measurements of this feature of local climate. Hopefully this would help increase student excitement about topics related to local weather and climate, and future rigorous pedagogical studies could document the impact of this tool on students’ learning.
Acknowledgments. The author thanks two anonymous reviewers for their comments, which helped improve this manuscript.
FOR FURTHER READING
Brandsma, T., and D. Wolters, 2012: Measurement and statistical modeling of the urban heat island of the city of Utrecht (the Netherlands). J. Appl. Meteor. Climatol., 51, 1046–1060, doi:10.1175/JAMC-D-11-0206.1.
Chow, W. T. L., R. L. Pope, C. A. Martin, and A. J. Brazel, 2011: Observing and modeling the nocturnal park cool island of an arid city: Horizontal and vertical impacts. Theor. Appl. Climatol., 103, 197–211, doi:10.1007/s00704-010-0293-8.
Lee, H., J. Holst, and H. Mayer, 2013: Modification of human-biometeorologically significant radiant flux densities by shading as local method to mitigate heat stress in summer within urban street canyons. Adv. Meteorol., 2013, 312572, doi:10.1155/2013/312572.
Mahoney, B., S. Drobot, P. Pisano, B. McKeever, and J. O’Sullivan, 2010: Vehicles as mobile weather observation systems. Bull. Amer. Meteor. Soc., 91, 1179–1182, doi:10.1175/2010BAMS2954.1.
Spronken-Smith, R. A., and T. R. Oke, 1998: The thermal regime of urban parks in two cities with different summer climates. Int. J. Remote Sens., 19, 2085–2104.
Whiteman, C. D., 2000: Mountain Meteorology: Fundamentals and Applications. Oxford University Press, 355 pp.