Removal of molybdenum oxide interference on cadmium

Michiko Yamanaka
Agilent Technologies, Japan
Keywords
cadmium, molybdenum oxide, environmental, food, CRMs,
hydrogen on-mass
Introduction
Cadmium (Cd) is a well-known toxic element along with As, Hg and Pb. The maximum contamination level of these elements in food, pharmaceuticals, drinking water, wastewater and other matrices is strictly controlled under national and international legislation. Out of the eight natural isotopes of Cd, only 111Cd is free from direct overlap by an atomic isobar (an isotope of a different element at the same mass as the Cd isotope), and even 111Cd is potentially subject to spectroscopic interference by 95MoO+. Fortunately, the concentration of Mo is low in most samples, and quadrupole ICP-MS (ICP-QMS) operating in helium collision mode can remove the interference, allowing the accurate measurement of Cd. However, there are some cases where the Mo concentration is high and a better interference removal technique is required in order to accurately determine Cd. This paper describes the application of MS/MS H2 reaction mode on the Agilent 8800 ICP-QQQ for the determination of trace Cd in the presence of a high concentration of Mo.
Experimental
Instrumentation: Agilent 8800 #100.
Indium (In) was introduced as the internal standard using the on-line ISTD kit.
Plasma conditions and ion lens tune:
RF power = 1550 W;
Sampling depth = 8.0 mm;
Carrier gas = 1.01 L/min;
Make up gas/dilution gas
(MUGS/ DiGS) = 0.0 L/min;
Soft extraction tune: Extract 1 = 0 V,
Extract 2 = -165 V, Omega bias = -100 V, Omega = 11.4 V.
CRC conditions: H2 flow rate 9.0 mL/min, Octopole bias = -22 V, KED = +5 V.
Acquisition parameters: MS/MS H2
on-mass method i.e.111Cd was measured at m/z 111 using quadrupole settings of
(Q1 = 111, Q2 = 111).
Results and discussion
Optimization of H2 flow rate
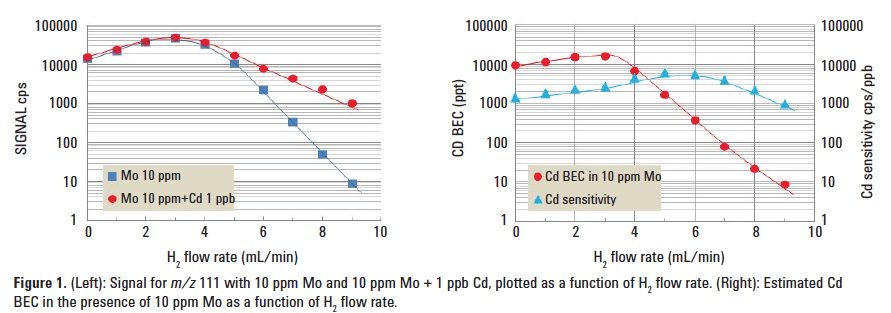
Figure 1 (left) shows the signal at m/z 111 for a 10 ppm Mo solution and a 10 ppm Mo + 1 ppm Cd solution, plotted as a function of H2 flow rate. Figure 1 (right) shows the calculated BEC of Cd in the presence of 10 ppm Mo. The optimum cell gas flow rate of 9.0 mL/min was used for subsequent experiments.
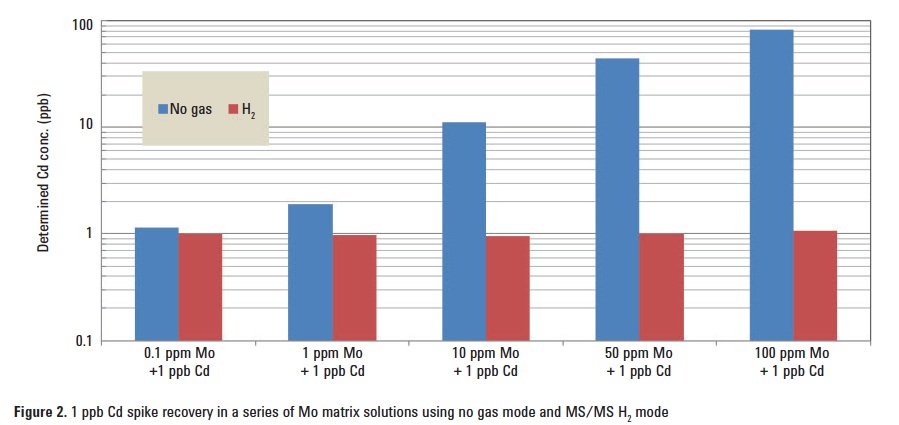
In order to test the effectiveness of MS/MS mode with H2 cell gas in comparison to no gas mode, a spike recovery test of 1 ppb Cd in a series of Mo matrix solutions ranging from 0.1 to 100 ppm was conducted. Figure 2 summarizes the results. In no gas mode, the error in quantification of the 1 ppb Cd spike dramatically increases with the concentration of Mo; in contrast, H2 reaction mode delivers a consistent and accurate result for Cd even in the presence of 100 ppm Mo.
Method validation: Analysis of Cd in CRMs
The concentration of Cd was determined in four different CRMs: NIST 1515 Apple Leaves, NIST 1573a Tomato Leaves, NIST 1575a Pine Needles and NMIJ 7531a Brown Rice Flour (National Metrology Institute of Japan). Each sample was microwave digested following the manufacturer’s recommended procedures, then diluted and analyzed by ICP-QQQ; the final dilution factor was around 100–200. For each CRM, the digested sample was analyzed using the developed method. A second sample of each CRM was prepared and analyzed after the addition of a 10 ppm Mo spike. As summarized in Table 1, good recoveries were obtained for all four references materials both for the unspiked samples and the duplicates with the high added Mo concentration, demonstrating the validity of the method for real sample analysis.