The benefits of improved abundance sensitivity with MS/MS for trace elemental analysis of high purity metals
Fred Fryer
Agilent Technologies, Australia
Keywords
quadrupole, resolution, hyperbolic, abundance sensitivity, copper, high purity zinc
Introduction
The use of a quadrupole mass filter for the separation of compounds in mass spectrometry is well established. Initially used for organic mass spectrometry and residual gas analysis, the quadrupole spectrometer was adopted for the earliest ICP-MS systems, and has remained the default choice throughout the history of
ICP-MS. However, the performance characteristics of the quadrupole mass filter do impose several limitations on quadrupole ICP-MS (ICP-QMS).
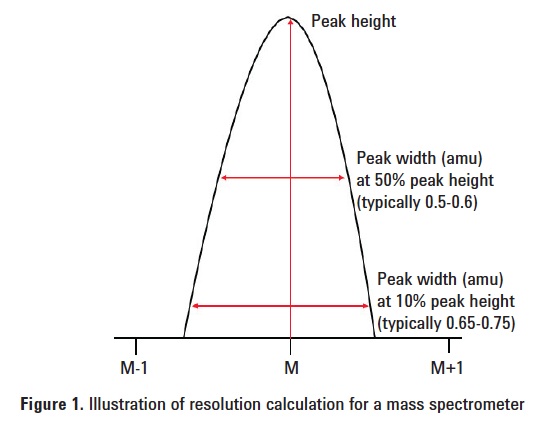
The resolution (R) of a mass filter (meaning its ability to separate adjacent masses) is defined as M/ΔM, the mass of the target peak/the mass difference to nearest adjacent peak that can be distinguished (separated). However, for practical specifications, the resolution is often simply quoted as the width of the peak at a given peak height. The quadrupole mass filter used in an ICP‑QMS instrument is typically operated with a nominal peak width of about 0.75 amu at 10% peak height, illustrated in Figure 1.
For two peaks within the normal signal range of the instrument, this allows the complete, baseline separation of masses
1 amu apart, within the elemental mass range from Li (7 amu) to U (238 amu) and beyond. Higher resolution of 0.4 amu peak width is possible by adjusting the quadrupole voltages, but the signal is reduced (less ion transmission) due to rejection of a higher proportion of the ions that are nominally “on-mass”. Typically the signal loss at higher resolution is around
10-50%, depending on the design and operating characteristics of the quadrupole.
Both the efficiency of transmission of ions at the set-mass (i.e., the sensitivity) and the rejection of ions at other masses (i.e., the resolution of adjacent peaks) are affected by the shape of the field within the quadrupole, and the frequency of the alternating RF fields.
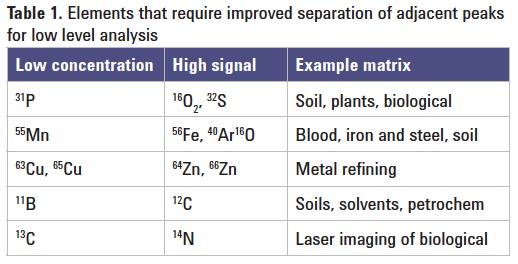
A hyperbolic field (generated by rods with a hyperbolic profile) alternating at high frequency gives more effective filtering of the ion beam than a lower frequency field generated by round quadrupole rods. The practical benefit of hyperbolic rods and high frequency RF voltage is therefore better ion transmission at higher resolution. Some of the many real-world applications where the combination of high sensitivity and good peak separation is required for adjacent low/high concentration elements measured by ICP-MS are shown in Table 1.
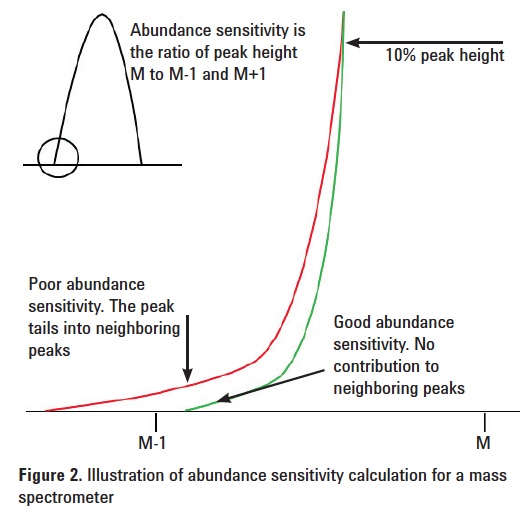
Due to the ion transmission characteristics of a quadrupole, the peak that is generated from the ion signals at each mass forms a non-symmetric Gaussian distribution with a negative skew; i.e., the peak has a longer tail on the leading edge (low mass side) than the trailing edge (high mass side). These “tails” may extend significantly beyond the limits of the nominal 0.75 amu peak width, but since they are at intensities far below 10% of the peak height, they cannot be measured using the simple resolution figure quoted above. The contribution that a peak at mass M makes to its neighbors at
M-1 amu and M+1 amu can be quantified, however, and this figure is referred to as the abundance sensitivity (AS) of the quadrupole, illustrated in Figure 2.
For a good quadrupole mass spectrometer in ICP-QMS, the AS would typically be of the order of 10-7, meaning that for an on-mass signal of 107 counts, there is a contribution of one count at the adjacent mass (M+/-1 amu).
In applications where the trace analyte must be separated from a very intense matrix peak at the adjacent M+1 mass, such as the examples shown in Table 1, the matrix peak may be at an intensity greater than 109 or 1010, and the AS of a quadrupole mass spectrometer is insufficient for accurate trace measurement of an adjacent overlapped analyte at low/sub ppb levels.
The problem of adjacent mass overlaps now has an elegant solution in the Agilent 8800 Triple Quadrupole ICP-MS (ICP-QQQ). The 8800 ICP-QQQ uses a tandem mass spectrometer configuration with two quadrupole mass filters (Q1 and Q2) separated by a collision/reaction cell. In MS/MS mode, both quadrupoles are operated as unit mass filters, so the overall AS of the instrument is the product of the Q1 AS x the Q2 AS. With two research-grade, high frequency, hyperbolic quadrupoles, each operating with AS of 10-7, the combined AS of the 8800 ICP-QQQ is theoretically 10-14, although this cannot be verified experimentally as the magnitude of the signal difference exceeds the dynamic range of the detector.
Experimental
Trace copper in high purity zinc
Major uses of Zn include galvanized coating to protect steel, die castings, and solder. Impurities in the metal cause Zn plating to lift, die casts to crack, or solder to ‘de-wet’, hence high purity zinc (>99.995 % ) is a preferred commodity. Common impurities are Cu, Au and Sb, but may also include Cd, Al, Fe, Ag, Bi, As, In, Ni, P, and S.
Instrumentation: Agilent 8800 #100.
Plasma conditions: Preset plasma/Low matrix.
Ion lens tune: Auto tune was used for optimization.
CRC conditions: Helium cell gas at
4.8 mL/min with KED of 4 V.
Results and discussion
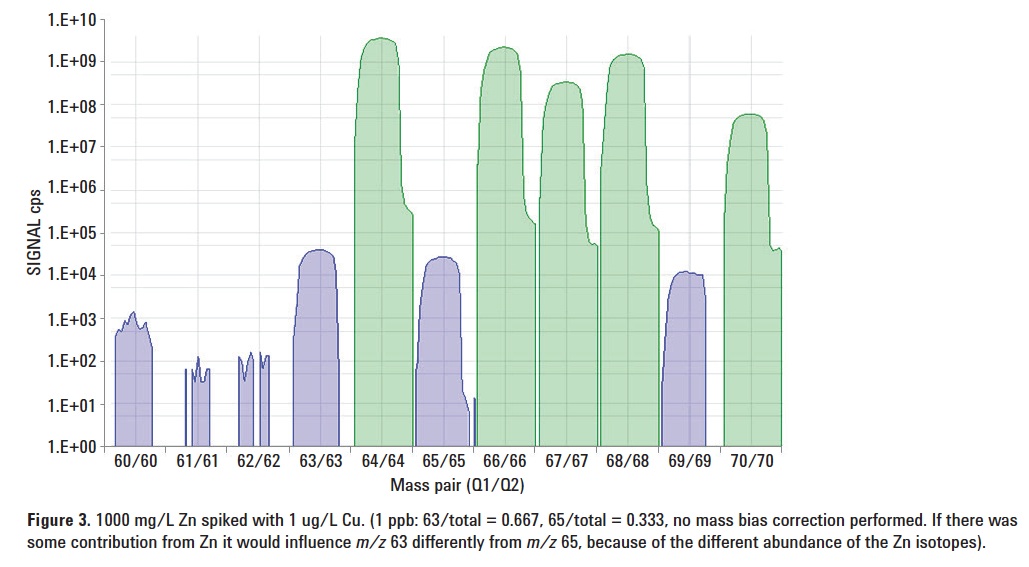
Analysis was performed on high purity Zn, dissolved to give a 0.1% (1000 mg/L) Zn solution in a final acid concentration of
2% HNO3. The sensitivity of the
8800 ICP-QQQ was reduced to bring the signal for the major Zn isotopes (64, 66) within the detector’s upper limit of dynamic range (~ 1010 cps). The intense Zn signals were measured automatically in analog detector mode, while the Cu isotopes were measured in pulse mode. It can clearly be seen in Figure 3 that the intense Zn peaks at m/z 64 and 66 made no contribution to the signal at the two adjacent trace Cu isotopes at m/z 63 and 65. The Cu isotope ratio matched the theoretical abundances (63Cu/65Cu natural ratio of 69.17/30.83), at
1 µg/L concentration. If there was a contribution from an adjacent Zn mass then the isotope ratio would be biased.
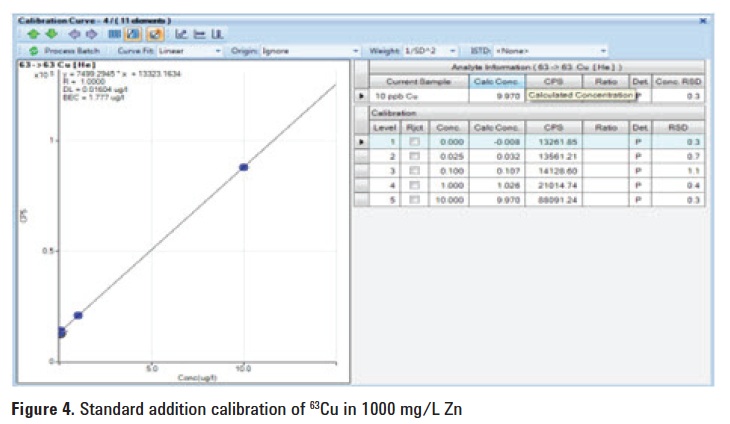
From the 63Cu calibration (Figure 4), the BEC and DL measured for Cu in the
0.1% Zn matrix were 1.7 ppb and 0.01 ppb respectively, indicating a low and stable background signal. The sensitivity of Cu was 7700 cps/ppb in 1000 µg/L Zn, under the “de-tuned” conditions used to bring the Zn peaks within the detector range. This represents about a 2x reduction in the signal that would be obtained under normal tuning conditions for this type of matrix, if measurement of the matrix element peaks was not required.