Synthetic Cannabinoids in Oral Fluid
Cynthia Coulter, Margaux Garnier,
and Christine Moore
Toxicology Research and Development, Immunalysis Corporation,
829 Towne Center Drive,
Pomona, California 91767
USA
Application Note
Forensics & Toxicology
Introduction
In 2011, five members of the “synthetic cannabinoids” group or ‘Spice’ compounds were banned in the USA. The substances were:
- 1-pentyl-3-(1-naphthoyl)-indole
(JWH-018) - 1-butyl-3-(1-naphthoyl)-indole
(JWH-073) - 1‑[2‑(4-morpholinyl)ethyl]‑3‑
(1-naphthoyl)-indole (JWH-200) - 5-(1,1-dimethylheptyl)-2-[(1R,3S)-
3-hydroxycyclohexyl]-phenol
(CP-47,497) - 5‑(1,1-dimethyloctyl)-2-[(1R,3S)-
3-hydroxycyclohexyl]-phenol (cannabicyclohexanol;
CP-47,497 C8 homologue)
The drugs have been described by users as having cannabis-like effects, and some of these compounds show strong binding to cannabinoid receptors. The (–)-1,
1-dimethylheptyl analog of 11-hydroxy-Δ8-tetrahydrocannabinol, (1,1-dimethylheptyl-11-hydroxytetrahydrocannabinol) is known as HU-210 and has been reportedly found in seizures of “Spice Gold”, “Spice Silver” and “Spice Diamond” made by the US Customs and Border Protection in 2009. HU‑210 is considered to be over 100 times more potent than Δ9‑tetrahydrocannabinol
(Δ9-THC), and was already classified as a controlled substance as an analog of marijuana. JWH-250 is also commonly encountered so was also included in the research.
Oral fluid is becoming increasingly popular as a specimen for the detection of drugs at the roadside, and in workplace testing. It is easy to collect, non-invasive and can give information on recent drug intake. In the work described here, the Quantisal device was used for oral fluid collection, and the detection of “Spice” components is described.
Collection devices, reagents
and standards
Quantisal devices for the collection of oral fluid specimens contain a cotton collection pad which is placed in the mouth. The incorporated volume adequacy indicator turns blue when 1 mL of oral fluid (± 10%) has been collected, then the pad is placed into transport buffer (3 mL), allowing a total specimen volume available for analysis of
4 mL (3 mL buffer + 1 mL oral fluid). Drug concentrations detected are adjusted accordingly.
Solid phase extraction columns (Bond Elut Plexa) and liquid chromatographic columns (ZORBAX RRHT) were obtained from Agilent Technologies. The standard compounds JWH-018, JWH-073, JWH-200, JWH-250, HU-210, CP-47,497 and
CP-47,497 C8 homologue as well as deuterated d9-JWH-018 and d7‑JWH‑073 were purchased from Cayman Chemicals.
Calibrators and controls
The deuterated internal standards (d9-JWH-018 and d7‑JWH‑073) and unlabelled drug standards were prepared in methanol at a concentration of 100 µg/mL. The working solutions were diluted from stock to a concentration of 10 µg/mL in methanol. The solutions were stored at –20 °C when not in use. Controls were prepared by fortifying drug-free synthetic oral fluid with various concentrations of compounds. Drug free negative specimens, positive controls at
4 ng/mL and 40 ng/mL were included in every batch.
Sample preparation
Seven calibration standards were prepared in oral fluid at concentrations of 0.5, 2, 5, 10, 20, 50, and 100 ng/mL for all analytes; deuterated internal standards were added (10 ng/mL).
Agilent Bond Elut Plexa (30 mg/1 mL;
p/n 12109301) solid phase extraction cartridges were used.
- Condition: methanol (0.5 mL); 0.1 M acetic acid (0.1 mL)
- To each 1mL aliquot of calibrator, control or specimen, add acetic acid (0.1 M; pH 4, 1 mL)
- Load samples
- Wash columns: DI water: glacial acetic acid (80:20; 1 mL); DI water: methanol (40:60; 1 mL)
- Dry columns (5 minutes)
- Elute acidic/neutral compounds: hexane: glacial acetic acid (98:2; 2 mL)
- Evaporate extracts to dryness while allowing columns to dry (7 minutes)
- Elute bases into corresponding tubes: ethyl acetate: ammonium hydroxide (98:2; 2 mL)
- Evaporate to dryness under nitrogen at 40 °C
- Reconstitute in methanol (50 µL); transfer to autosampler vials; cap
- Analyze using LC-MS/MS
Liquid chromatography tandem mass spectrometry (LC-MS/MS)
An Agilent Technologies 1200 Series liquid chromatography pump coupled to an Agilent 6430 Triple Quadrupole LC/MS System, operating in electrospray ionization mode (ESI) with either positive or negative polarity depending on the compound.
Column
Agilent ZORBAX RRHT Extend C18,
(2.1 × 50 mm, 1.8 µm, p/n 727700-902)
Column temperature
60 °C
Injection volume
5 µL
Mobile phase
Solvent A: 0.2% acetic acid and
Solvent B: acetonitrile
Time
0: 95% A; 5% B;
5 min: 100% B;
7 min 5% B
Run time
9.2 min; Post-time 3 min
Flow rate:
0.5 mL/min
Nitrogen gas temperature
350 °C
Gas flow
10 L/min
Nebulizer pressure
55 psi.
Capillary voltage
+4,000 V in positive mode;
–4,000 V in negative mode
Two transitions were selected and optimized for each drug. Table 1 shows the transitions, the optimized fragment voltages for the parent ion (M +1; M-1) as well as the collision energy for fragmentation of the product ions. Each subsequent analysis required the ratio between the quantitative ion and the qualifier ion to be within ± 20% in order to meet the criterion for a positive result.
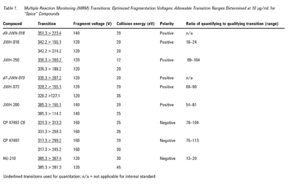
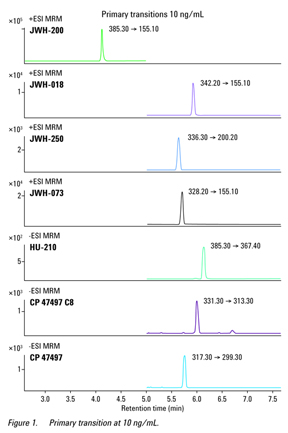
Figure 1 shows a chromatogram for the primary transitions of the compound at a concentration of 10 ng/mL; the ratio of primary to secondary transition for each compound was also determined at
10 ng/mL.
Recovery from the collection pad
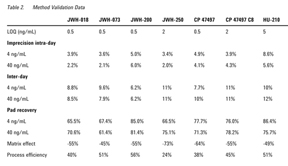
Six synthetic oral fluid specimens fortified with the compounds at concentrations of 4 and 40 ng/mL were prepared. The collection pad was placed into the samples until 1 mL (±10%) had been collected, as evidenced by the blue volume adequacy indicator incorporated into the stem of the collector, then the pad was transferred to the Quantisal buffer, capped and stored overnight to simulate transportation to the laboratory. The following day an aliquot of the specimen was analyzed. The amount recovered from the pad was compared to an absolute concentration (100%) where drug was added to the buffer and left overnight at room temperature without the pad, then subjected to extraction and analysis.
The percentage recovery from the pad for the compounds at concentrations of 4 and 40 ng/mL (n = 6) were > 60% for all at both levels. The highest recovery was 86% for HU-210 at 4 ng/mL; the lowest was 61% for JWH-073 at 40 ng/mL. The recoveries were essentially equivalent at both levels (Table 2).
Data Analysis
Calibration was carried out using linear regression analysis over a concentration range of 0.5–100 ng/mL. Peak area ratios of target analytes and the internal standard were calculated for each concentration using Agilent MSD software. The data were fit to a linear least squares regression curve, not forced through the origin, and with equal weighting. For confirmation, two transitions were monitored for each of the compounds; one for the internal standard. The ratio of the qualifying transition was required to be within 20% of that established using the known calibration standard to be acceptable.
Linearity and sensitivity
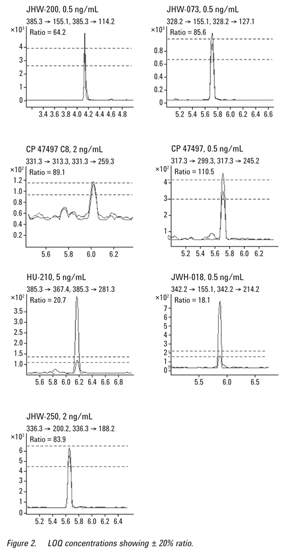
The limit of quantitation (LOQ) of the method was determined using serial dilutions to the lowest point where the acceptable criteria for the quantitation of a compound were met, that is, the chromatographic peak shape, retention time (within 2% of calibration standard), and qualifier transition ratio
(± 20%) compared to the 10 ng/mL calibration standard were acceptable. The quantitative value of the LOQ had to be within ± 20% of the target concentration. The limit of quantitation was 0.5 ng/mL for JWH-018, JWH-073, JWH-200, and CP 47497;
2 ng/mL for CP 47497 C8 and JWH-250;
5 ng/mL for HU-210 (Figure 2). Linearity was acceptable from the LOQ to 100 ng/mL (R2 > 0.99; n = 5) for all compounds.
Matrix effects
A nonextracted drug standard at a concentration of 10 ng/mL was prepared as well as drug free matrix extracts and negative controls (extracts containing only internal standard). The recovery of the compounds from the oral fluid was determined by first assessing the response of the extracted samples (n = 3) at a concentration of 10 ng/mL {RES}. Then, oral fluid was extracted and drug was added postextraction at a concentration of
10 ng/mL (n = 3) {RPES}. The percentage recovery was then calculated from the equation (RES/ RPES) × 100.
The reduction in response due to matrix effects (ion suppression) was determined by assessing the peak area response of a nonextracted neat drug standard (n = 3) at a concentration of 10 ng/mL {RNES}. The nonextracted solution was analyzed in the same reconstitution solvent as the extracted specimens. The % matrix effect was then calculated using the equation (RPES / RNES) -1 × 100. The overall efficiency of the process was calculated as (RES / RNES) × 100.
Ion suppression effects were significant, but were limited by the use of solid-phase extraction and deuterated internal standards.
Selectivity
Five drug free oral fluid specimens were collected using the Quantisal device. An aliquot of each was taken and subjected to extraction and analysis as described, in order to assess potential interferences associated with endogenous compounds or the transportation buffer.
In addition, common drugs of abuse were added at concentrations of 2,000 ng/mL to other aliquots of the drug-free fluid, extracted, and analyzed as described.
THC amitriptyline
THC-COOH cyclobenzaprine
11-OH-THC imipramine
cannabinol dothiepin
cannabidiol doxepin
cocaine fluoxetine
benzoylecgonine sertraline
norcocaine trimipramine
cocaethylene protriptyline
codeine chlorpromazine
morphine clomipramine
6-AM nortriptyline
6-AC paroxetine
oxycodone desipramine
oxymorphone bromazepam
hydrocodone alprazolam
hydromorphone clonazepam
amphetamine lorazepam
methamphetamine oxazepam
MDMA diazepam
MDA midazolam
MDEA flurazepam
phentermine flunitrazepam
fentanyl nordiazepam
phencyclidine triazolam
tramadol temazepam
carisoprodol nitrazepam
meprobamate chlordiazepoxide
citalopram methadone
venlafaxine
No endogenous interference was noted from drug free extracts; or for exogenous interference from any of the commonly encountered drugs, including THC and its main metabolites, which were analyzed at high concentration.
Imprecision
Specimens were fortified with all the compounds simultaneously at concentrations of 4 ng/mL and 40 ng/mL. Each concentration was analyzed according to the described procedure (n = 6; intra-day imprecision) for 5 consecutive days (n = 30; inter-day imprecision). The intra-day imprecision of the assays for all drugs was < 9% at both concentrations; inter-day < 12% at both concentrations (Table 2).
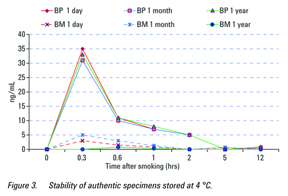
Authentic samples
Specimens were collected from two naïve volunteers, who had purchased the compounds while still legally available in the USA. Subject number 1 smoked “Blueberry Posh” and subject number 2 smoked “Black Mamba”. Using Quantisal oral fluid collection devices, specimens were collected prior to the start of smoking, then at the various time points after smoking. Subject 1 gave specimens after 20 minutes, 40 minutes,
1 hour, 2 hours, and 12 hours; Subject 2 gave samples after 20 minutes, 40 minutes, 1 hour, 5 hours, and 12 hours. The specimens were analyzed the day after collection, then were stored at 4 °C for one month and re-analyzed with a different method. A year later, they were re-analyzed using this procedure. It was not possible to procure authentic specimens at this time since the compounds are no longer
available legally.
The main active compound in the two preparations was determined to be JWH-018. After storage at 4 °C for one month the samples were reanalyzed and found to be extremely stable with almost identical concentrations detected. When the specimens which had been stored at 4 °C for a year were re‑analyzed, the concentrations in Subject number 1 were essentially the same as the previous year; the levels in Subject number 2, which were much lower originally, had generally declined (Figure 3).
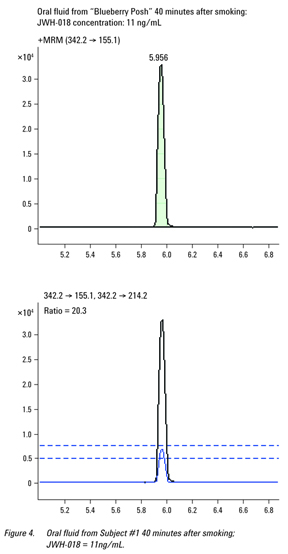
An extracted ion chromatogram showing the transitions and ± 20% acceptability band around the intensity of the qualifying transition from the sample collected 40 minutes after smoking (Subject number 1) is presented in Figure 4; the concentration of JWH-018 was 11 ng/mL.
Summary
The simultaneous determination of several “Spice” compounds in oral fluid is reported for the first time. The procedure is applicable to the analysis of specimens collected using the Quantisal device for the presence of synthetic cannabinoids, which were recovered from the pad > 60% at two concentrations. Following a single smoking session of two different herbal product brands, JWH-018 was detected in oral fluid with the highest concentrations appearing 20 minutes after a single smoking session. Even after a year, JWH-018 was detectable in the oral fluid 12 hours after a single smoking session of “Blueberry Posh”.
For More Information
These data represent typical results. For more information on our products and services, visit our Web site at www.agilent.com/chem.
©Agilent Technologies, Inc., 2012
April 20, 2012
View this Application Note in its entirety: 5990-9679EN